

- The OHM coin price slips below the several EMA’s during intraday.
- The 24-hour trading volume is at $132 million.
- OHM/BTC pair is trading positive by 8.8% at 0.01309436 BTC.
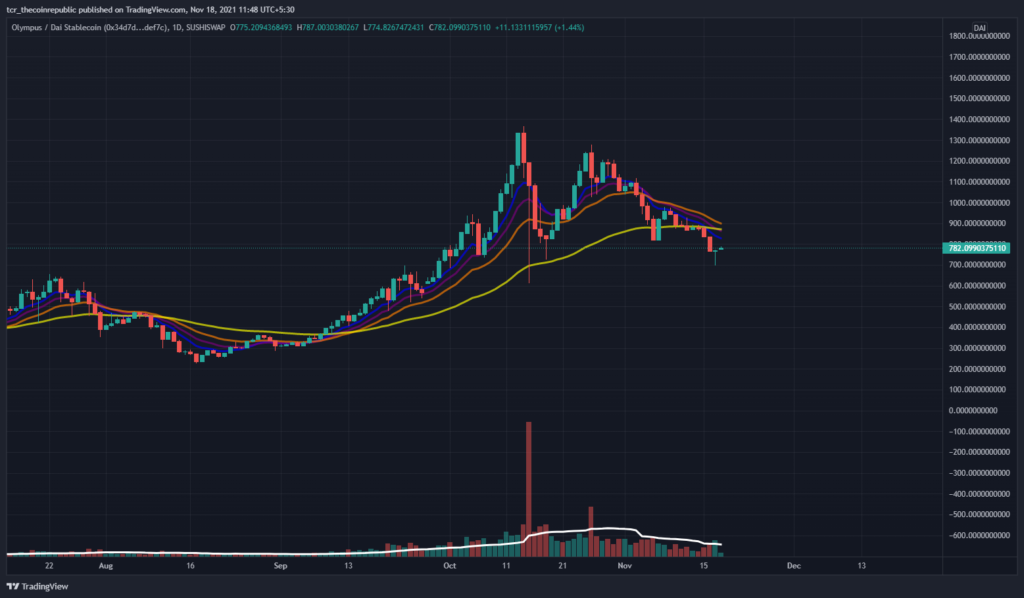
Moving Average (EMA) In the OHM coin daily price chart containing 8,13,21,55 EMA, it is a reliable support for currency price movements. Investors can find that price moves below the yellow line and guarantee an OHM downtrend as long as prices are below the moving average.
The volume (10.303 M) is below the 20-day moving average (37.565 M). The volume is low, so the cost is struggling for several days. Investors may also mark a decrease in volume. This indicates that unusual changes are normal on the following trading days.


OHM Coin Price Action Looks Stable Above $500
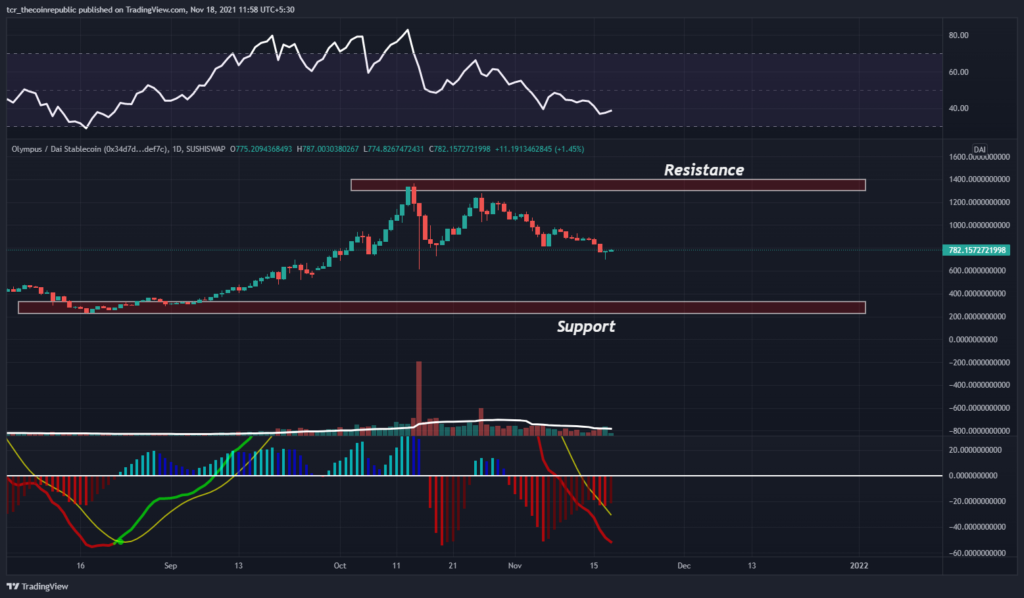
The daily price chart of the OHM coin moves towards the support zone. Depending on the price action, the support area is within $250 – $350. On the flip side, the resistance range to look for is around $1300 – $1400.
The RSI showed a signal of 38.62 (bearish) with a short-term sell sign. Investors may find that the indicator’s RSI line is running downside. A plunge can happen on future trading days.
The MACD shows a (bearish) cross below the signal line on October 31, indicating a sell signal for the currency. In addition, investors can see red bars in the histogram indicator.
Conclusion
Olympus price today is $787.24 with a 24-hour trading volume of $132,600,426. OHM price is up 8.8% in the last 24 hours. It has a rotating quantity of 4.5 Million OHM coins and a whole amount of 5.42 Million.
RSI and MACD indicate a sell signal. Traders have directed low volume. In fact, the cost got rejected from the resistance zone. A market overview also shows that this pattern will continue to plunge in the coming trading days.
Resistance Level: $1400 & $1300
Support Level: $250 & $300


