

- The RSI line shows a significant drop in its value concerning the XTZ coin price
- The XTZ/BTC pair was trading at 0.0001138 BTC, with a loss of 1.08%
- The XTZ coin’s 24-hour trading volume is $310.9 Million, indicating a 16.7% loss
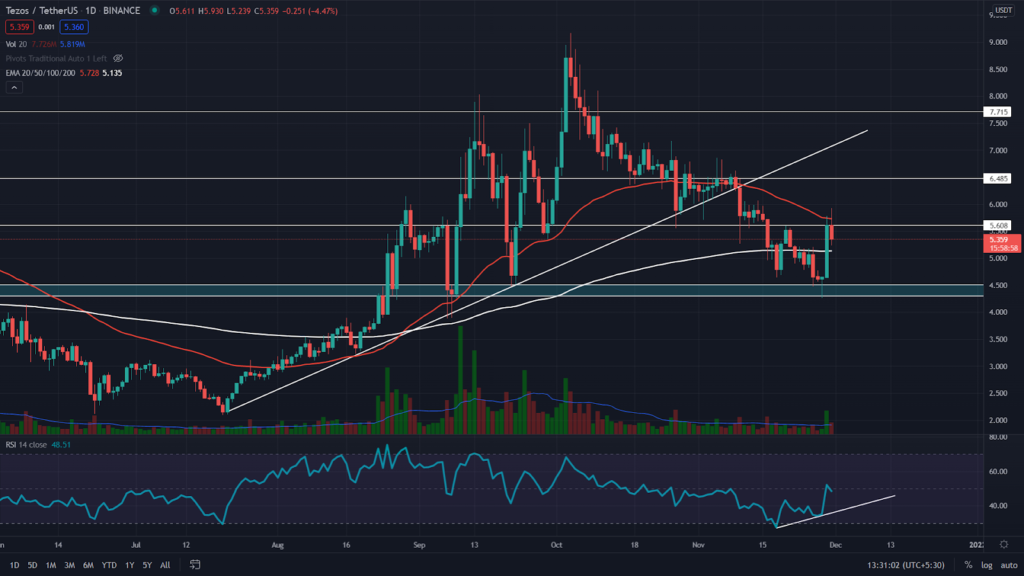
The retracement phase of the XTZ coin initiated in October continued for this month as well and dropped the price to $4.5 support. The technical provided an excellent opportunity for short traders when the price breached a support trendline that carried a bull rally since August.
The coin price is currently trying to identify sufficient demand pressure from the bottom support level, which could help to start a new rally. The current price of the XTZ coin is $5.3, with an intraday loss of 5.12%


Concerning the EMAs, the XTZ coin price recently reclaimed the 200 EMA line, indicating the coin maintains a bullish trend in the coin. Furthermore, the RSI value of 47 indicates a slightly bearish sentiment within the XTZ coin. However, for the second support at the $4.5 mark, the RSI line presents a bullish divergence in RSI, suggesting the increasing strength of market buyers.
The XTZ Coin in the 4-hour Time Frame Chart
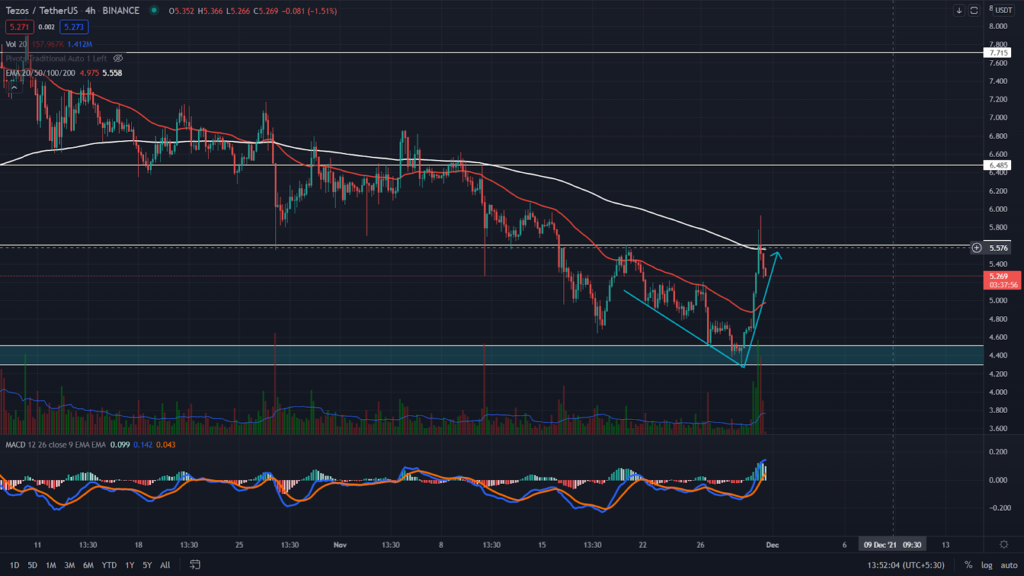
The XTZ coin indicates a sharp recovery after the coin retested the bottom support of $4.5. However, the price is currently facing strong rejection from the nearest resistance of the $5.6 mark, indicated by an evening star candle pattern. If the price decides to tank again, the 50 EMA can help the price to hold up.
The moving average convergence/divergence indicates the price has recently crossed above the neutral zone(0.00), projecting a bullish momentum in this coin.
Conclusion: From the technical perspective, the short-term trend of the XTZ coin remains bearish. However, as mentioned above, the price bounced back from the $4.5 support hoping to continue this bull rally. Anyhow, the price needs to breach the $5.6 resistance, which could provide the crypto trader a great entry opportunity to go long.
Support: $4.5
Resistance – $5.6


