

- After a sharp selloff over the past 4 days, the Ecomi token is looking in a bullish zone today.
- OMI token has been maintaining the cost below the leading span A ($0.004363-mark) of the Ichimoku indicator for a long time.
- The OMI/BTC pair price is trading bearish by 3.7% at 0.00000009329 Satoshis.
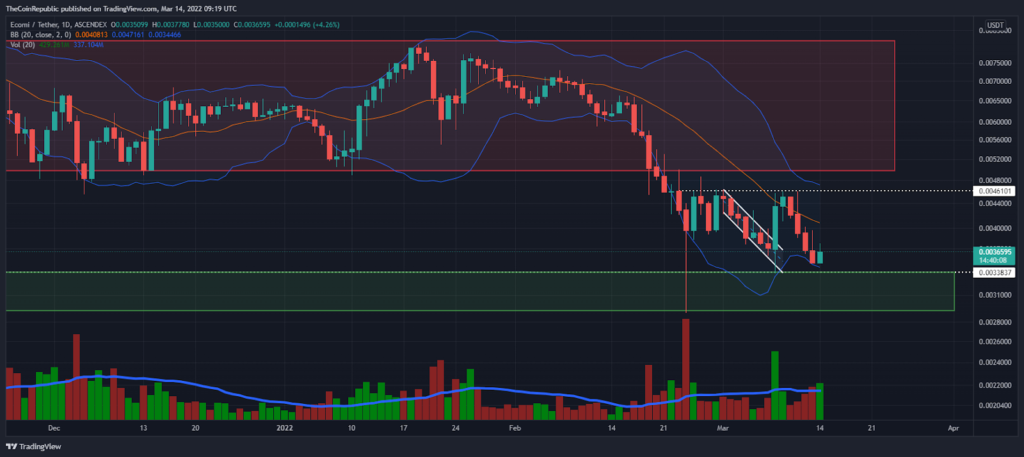
The price of ECOMI token is trending downwards after breaking out of the broad consolidation phase (Redzone), and the asset is noted for the year 2022 as the lowest level of $0.0029. Bulls attempted recovery several times, but there is a strong sell point near sellers around $0.0046, resulting in the crypto having formed a double top above the demand zone (green).
However, last week the token managed to overcome a falling parallel channel (white), and the coin saw its cost increase by 21%. But on March 10, the bears again started selling, as a result of which the token kept falling for 4 days. Despite the sharp selloff, the bulls are trying to hold the OMI token price today, which is up by 4.25% at $0.0036591 at the time of writing. Moreover, the OMI/BTC pair price is trading bearish by 3.7% at 0.00000009329 Satoshis.


The halfway line of the Bollinger Bands indicator has been a strong resistance line for a long time, and buyers recently failed to break above this bullish barrier in the context of the daily price chart. Now OMI token price is seen trading above BB indicator low. Thus, the coin has increased the trading volume by 14% in the last 24 hours. Meanwhile, the volume to market capitalization ratio is 0.008249.
Will the bulls be able to celebrate the recovery phase of OMI Token?

ECOMI token price has remained below the 20-day moving average (white) for the past several days. Meanwhile, the remaining moving averages such as the 50,100 and 200 MA are well above the current price.
Stoch RSI is trending down with reference to the daily price chart. The RSI is showing weakness for OMI Token by staying below the halfway level (50 points). Furthermore, the Average Directional Index is at 38-level, suggesting a bearish momentum consolidation for OMI Token.
Conclusion
OMI investors need to break the sharp bounce-back 20-MA as soon as possible; otherwise, they will see bloodshed below the demand zone.
resistance level – $0.0050 and $0.0080
support level – $0.0034 and $0.0022
Disclaimer
The views and opinions stated by the author, or any people named in this article, are for informational ideas only, and they do not establish financial, investment, or other advice. Investing in or trading crypto assets comes with a risk of financial loss.


