Universal High Income
 OnlyAgent
 Aerodrome Finance
 Pudgy Penguins
 Monero
 Pearl
 Quantus

- Algorond coin price is trading into the falling wedge chart pattern and observing near above the vital support level.
- ALGO coin has been underperforming for the past 5 months, therefore crypto lost around 77% of its cost.
- The ALGO coin with the Bitcoin pair is trading at 0.00001769 Satoshis, which is slightly bullish by 1.20%.
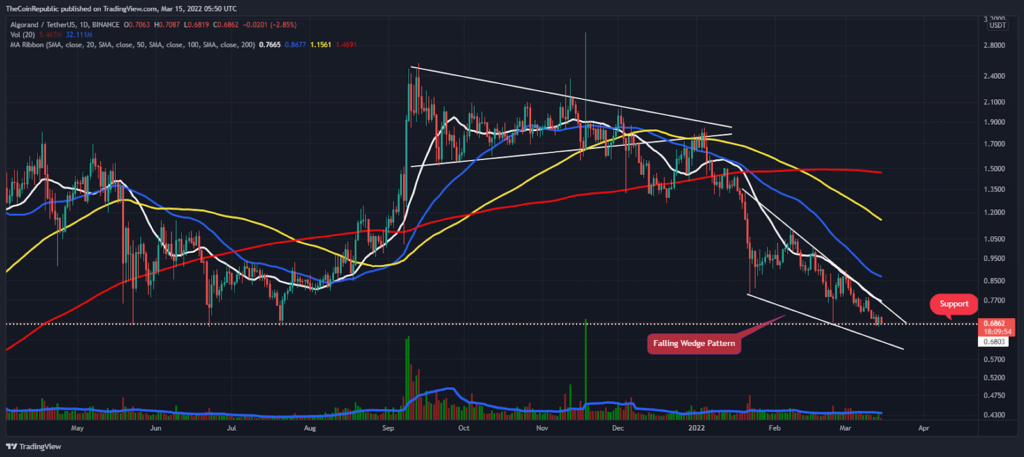
The Algorand coin has been on a frequent downtrend after noticing a high of $2.83 in the year 2021, as the coin there has lost almost 77% of its value in just 5 months. In late 2021, ALGO saw an ascending triangle pattern where panic sellers took advantage. Thus, the price action of the digital currency is observing a falling wedge pattern (white) in the context of the daily chart.
ALGO holders keep the price of the cryptocurrency above the crucial support level of $0.68 (which has been valid for the past 10 months); below the critical support, the bulls could be a victim of a bloodbath. Meanwhile, at the time of writing, ALGO is showing a downside movement of 2.87% at $0.6860 (as per the Tradingview chart). For recovery, buyers will have to overcome the declining wedge pattern. Moreover, the Algorand coin with the Bitcoin pair is trading at 0.00001769 Satoshis.
Despite the bearish trend, trading volume is still showing low liquidations for ALGO Coin, and the daily trading volume bar remains below the moving average (blue). Meanwhile, the coin has gained 25% trading volume in the last 24 hours. Meanwhile, the volume to market capitalization ratio is 0.02963.
What does a falling wedge pattern mean: breakdown or breakout?
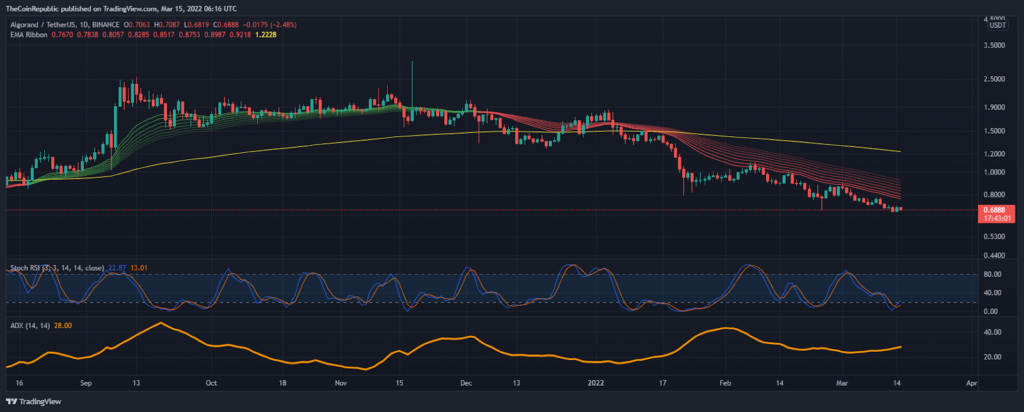
Algorand coin price is trading below important moving averages (such as 20, 50, 100 and 200 MA) in terms of the daily price chart. Similarly, the price is currently trading well below the Red Moving Lines of the EMA Ribbon indicator, which is the most giant sign of weakness for long-term holders.
Recently, Stoch RSI generated a crossover under the oversold area, where D is looking at 23-points; similarly, D is looking at 13-points. Bulls can take advantage of this signal. Furthermore, the Average Directional Index is moving higher, which suggests strong momentum for the ALGO coin.
Conclusion
Algorand coin is trading near a significant support level, and traders should wait to confirm a directional trend. If the bulls manage to hold the coin price above $0.68, there could be a breakout of the descending wedge pattern. On the other hand, ALGO could reach lower levels.
Support level- $0.680 and $0.370
Resistance level- $0.88 and $1.30
Disclaimer
The views and opinions stated by the author, or any people named in this article, are for informational ideas only, and they do not establish financial, investment, or other advice. Investing in or trading crypto assets comes with a risk of financial loss.