
 Pearl
Pearl Bitcoin
 NEAR Protocol
 Starknet
 Solana
 Quant
Quant Ondo
Ondo
- Loopring price got stuck inside a descending triangle pattern and now in the serious situation of make or break at the moment.
- The crypto asset fell below 20, 50, 100 and 200-days Daily Moving Average.
- The pair of LRC/BTC is at 0.00001967 BTC with an intraday drop of 4.33%.
Loopring price must find a way to pump itself from here because the bad news is Bitcoin is also falling. Other altcoins just rally and follow the paved way of BTC throughout the trading sessions. Loopring coin is in a strong make or break condition. The token must gather support to escape the descending triangle pattern with a breakout. However, the token falters presently to gain support ad trading with downward momentum.
Loopring price is presently CMP at $0.71 and has lost 2.67% of its market capitalization in the last 24-hour period. Trading volume has decreased by 42.77% in the intraday trading session. This signifies that the token is facing short selling and dipping towards the lower trendline of the descending triangle pattern. Volume to market cap ratio is 0.1338.
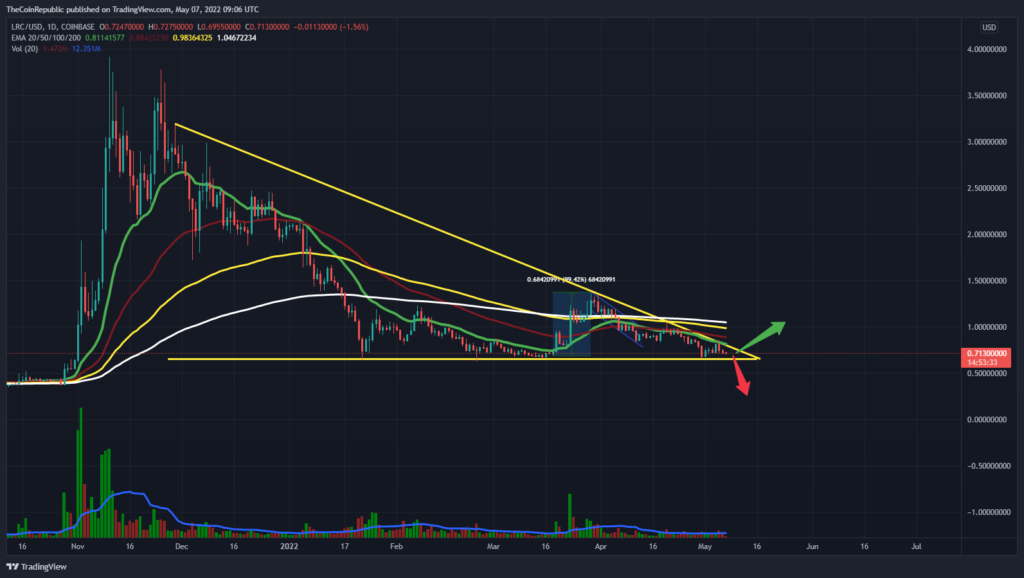
Loopring price must get the demand fulfilled to pump up with breakout from the descending triangle pattern over the daily chart. LRC token must sustain and accumulate bulls to register its breakout. This make or break situation arises due the fall of traditional cryptocurrency which is Bitcoin. Volume change can be seen below average and needs to grow for LRC to register its breakout.
LRC finds a way to Pump or get Dumped?
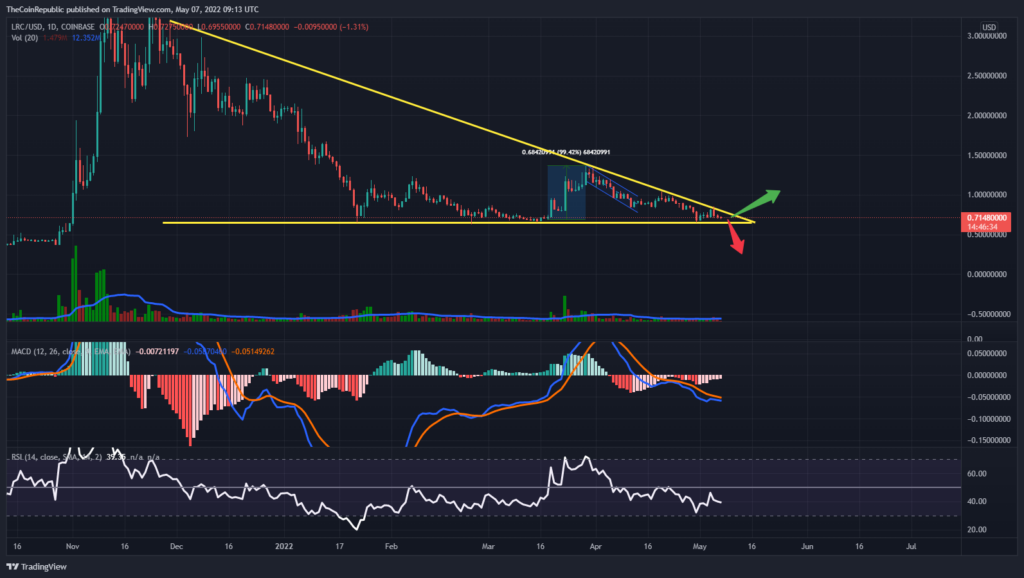
LRC coin got trapped inside a descending triangle pattern over the daily chart. LRC pumps from or here or get dumped by the bears by dipping through selloff. Technical Indicators suggest consolidation phase of LRC token in the descending triangle pattern.
Relative Strength Index showcases movement from neutrality to the oversold territory. RSI is at 39 and investors may expect any directional change upto 35.
MACD exhibits sideways momentum of LRC token. The MACD line is below the signal line waiting for any type of crossover.
Conclusion
Loopring price got stuck inside a descending triangle pattern and now in the serious situation of make or break at the moment. Loopring price must find a way to pump itself from here because the bad news is Bitcoin is also falling. Technical Indicators suggest consolidation phase of LRC token in the descending triangle pattern.
Technical Levels
Support Levels: $0.65 and $0.40
Resistance Levels: $1.00 and $1.50
Disclaimer
The views and opinions stated by the author, or any people named in this article, are for informational ideas only, and they do not establish the financial, investment, or other advice. Investing in or trading crypto assets comes with a risk of financial loss.




