
 Minter
 Quack AI
 Quantus
 Pudgy Penguins
 Bitcoin
 Bittensor
 Boomer
- Quant price broke the long term bearish trend line while the price remained above the $100 mark.
- At the time, QNT price was struggling near the 100-day EMA.
- According to data from CMC over the past 24 hours, the market cap of the QNT token has increased by 26.3% to $1.3 billion.
The Quant token was seen above the $100 conceptual round level after a long run. The altcoin’s price has risen dramatically in the last two weeks, with gains of up to 80%. Furthermore, the altcoin recently broke the $75 and $100 resistance levels, giving bullish traders an additional advantage.
The price of QNT continues to rise, and bulls are taking a deep breath. Over the last two weeks, the price has been steadily rising, pushing it above the critical $100 resistance level. As a result, at the time of writing, the Quant token is trading at $108. Now, as immediate support, a psychological round of $100 has appeared.
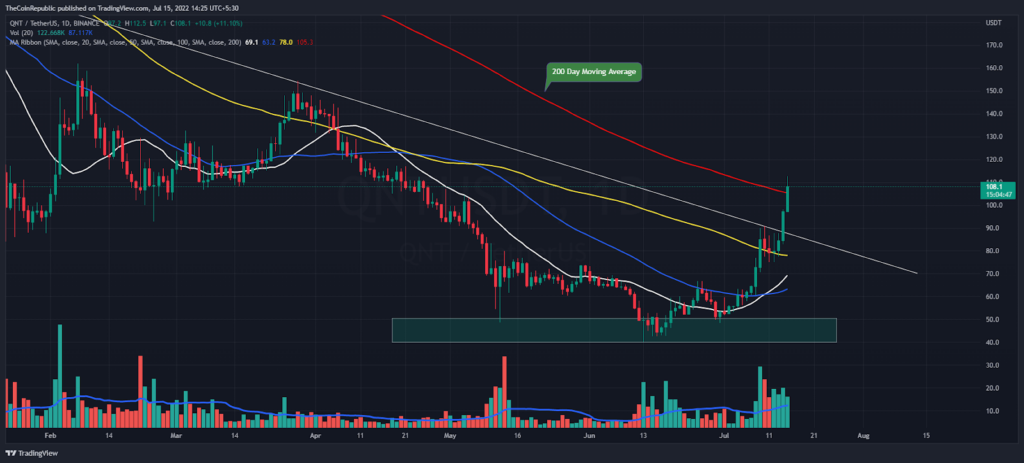
The QNT token appears to be in a solid bullish trend as the price broke the key moving averages such as 20, 50 and 100 in the context of the daily price chart. Meanwhile, QNT price was struggling near the 100-day EMA. If buyers close the daily price candle above the 200 DMA, there could be another bullish rally towards the next resistance at $150.
According to data from CMC over the past 24 hours, the market cap of the QNT token has increased by 26.3% to $1.3 billion. Moreover, the price of Quant pair with Bitcoin pair is up 20.6% at 0.00519 satoshis. Similarly, trading volume increases gradually in the midst of an uptrend.
RSI reached in extreme overbought zone
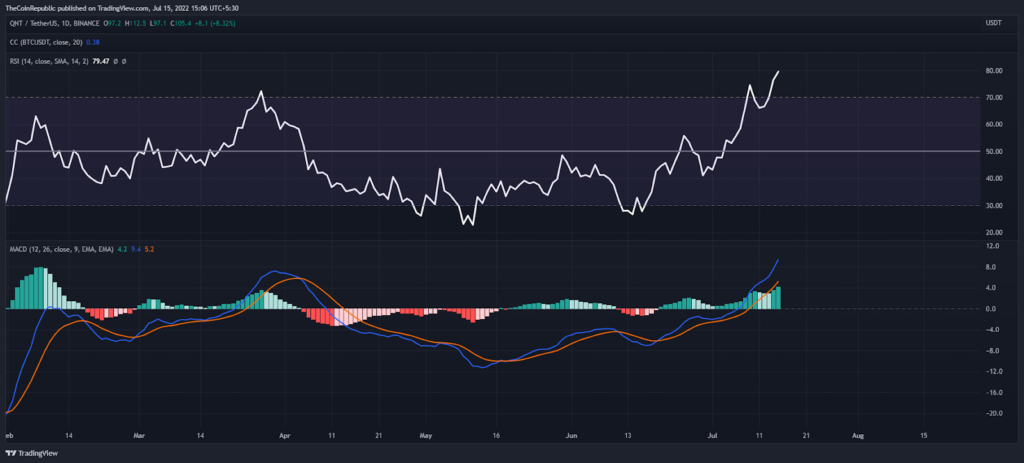
In terms of the daily price chart, the RSI indicator is about to enter an overbought zone. Similarly, the MACD indicator is also present in a positive trend with a rising histogram.
Conclusion
The RSI and MACD indicators are showing a bullish trend for the Quant coin as they are both moving upwards. Meanwhile, price action is forming higher-highs on the daily price graph.
Support level – $100 and $50
Resistance level – $150 and $200
Disclaimer
The views and opinions stated by the author, or any people named in this article, are for informational ideas only, and they do not establish the financial, investment, or other advice. Investing in or trading crypto assets comes with a risk of financial loss.




