

- Zilliqa token shows breakdown moves trades below 20 day EMA.
- ZIL is showing double top formation on daily charts.
Zilliqa shows weaker cues in the past trading sessions, registering a breakdown on daily charts. After a long battle between the buyers and sellers, the bears have finally taken charge of the coin, and now the bulls have to break this bearish trend.
However, the bulls have barely managed to make the coin regain its potential. The bulls tried to attempt a bounce, but the bearish signs are there now.. Currently, the bears have brought the price to follow the downward curve with steady downward momentum. The bulls may reverse this curve, and the price may rise. This is the time for new investors to look out for to initiate new positions.


When writing, the ZIL token is trading at a price of $0.02451 with an intraday gain of 2.55% The current trend of Zilliqa is mild-bearish based on the last few trading sessions. Moreover, the trading volume also shows an increase of 5.20%. The downward trendline breakdown curve could be a disaster for the investors and the whales.
If the bearish trend continues, the price may drop to the primary support of $0.03701, and if the bulls show the same stillness, we may see the price lower to the secondary support of $0.02270. If the bulls attempt a bounce with better execution and beat the bears, the price may reach the primary resistance of $0.02500. The bulls must accumulate to show their dominance to bring any directional change.
Zilliqa coin Daily Charts Shows Breakdown
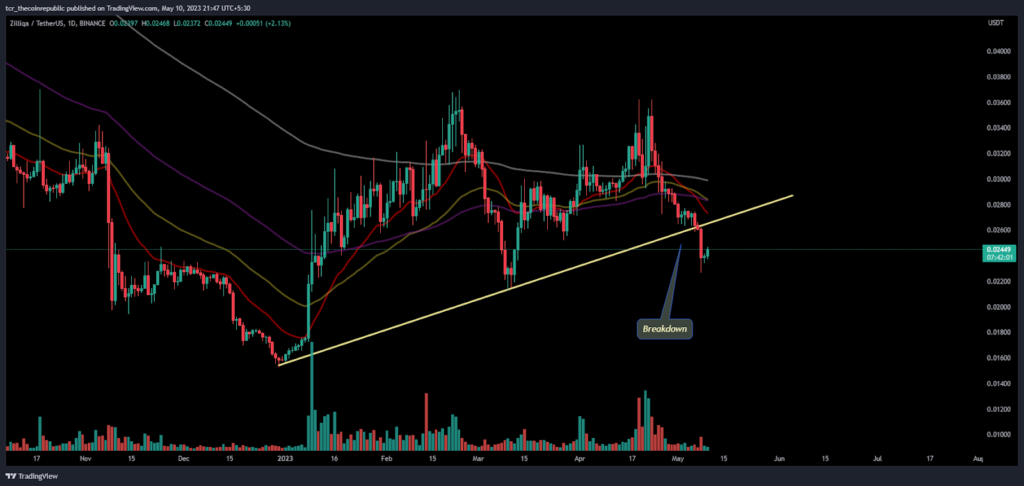
The ZIL token attempted a bounce on the daily charts and fetched a 20-day EMA.
Zilliqa’s price has fallen by 20% from its recent highs and is surging over the daily price chart.
Zilliqa token at first showed a massive breakout from the consolidation phase and got rejection near $0.03000. Recently ZIL formed a double-top pattern over the daily price chart. ZIL coin must sustain nearby the demand zone to surge upwards. However, buyers are accumulating to pull the token back to higher levels.
What Traditional Indicator Says?
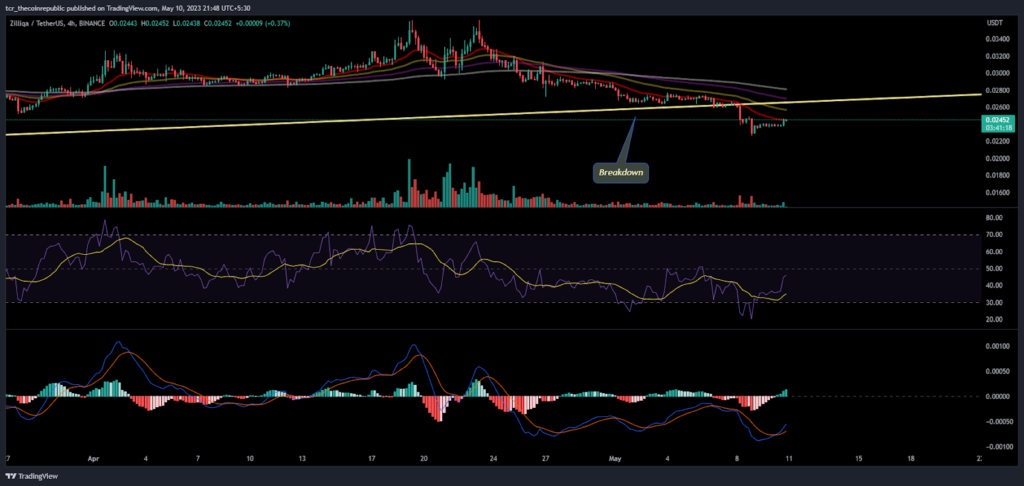
On the short-term charts, the ZIL token attempted to bounce and attain a 20-day EMA. The RSI of the token is near 45 and shows a positive crossover on the curve. The MACD curve also shows a bullish crossover and green bars on the histogram.
Conclusion:
Zilliqa’s price shows downside momentum, but buyers continue to accumulate. ZIL crypto must attract more buyers during the day’s trading session to initiate the gains.
Technical Levels:
Support Levels: $0.02400
Resistance Levels:$0.02600
Disclaimer
The views and opinions stated by the author, or any people named in this article, are for informational purposes only and do not establish financial, investment, or other advice. Investing in or trading crypto assets comes with a risk of financial loss.


