

- ICP token was unable to pull away above 20-day EMA.
- The Bulls are trying to regain their shine before any breakout.
ICP token price struggles on the daily chart, rescuing gains and trying to attain strength; bulls are now trying to be in perfect shape. ICP, in the last sessions, trapped the sellers maintaining the grips near $5.20, which was the primary support mark.
Bulls try to rescue the gains and allow their muscles to lift the token’s weight to perform the breakout. Moreover, technical parameters suggest that the token is ready for a bounce.


Still, aggressive sellers already maintain the grip of those who want to stay on the range, a barrier to a smooth journey. This uneven move tumbled the token to hover near the congestion zone of $5 -$7. After fleeing the range, a strong price rally can be seen because the investors are much awaiting the move, which, if begun, will initiate the run and comply with the gains.
When writing, the ICP token trades at $5.30 with an intraday gain of 3.34% showing bulls muscles. The trading volume also rose by 1.20% in the overnight trading session. The pair of ICP/BTC is at 0.00019 satoshis.
ICP on daily charts
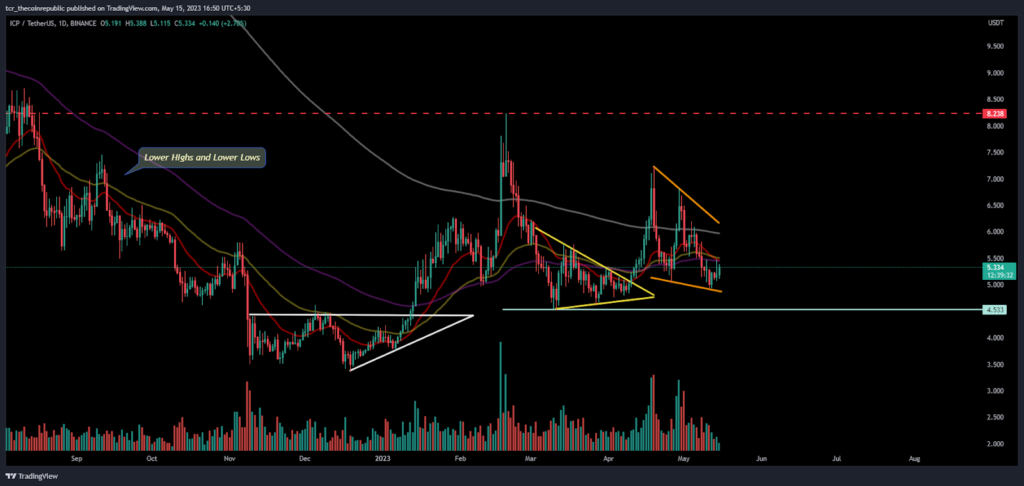
On the daily charts, the ICP token shows a falling wedge pattern with a trajectory upside range of $8.00 to be retested. Moreover, the token has a pennant formation which was recently broken out by the bulls, and the delivery volume also rose in the recent sessions.
However, the leading indicators suggest an upside momentum of the token if the token sustains above the 20-day EMA near $6.00. Sellers will slowly cover their positions above the mark, and buyers will begin accumulating the token.
As per the Bollinger band, the ICP token bounced from the lower band and now trying to claim attention towards the middle Bollinger band. Moreover, the Fib level shows that the token is taking support at 23.6% level and trying to show the muscles again to beat the bears in this contest.
Short Term Charts Shows Bulls Dominance
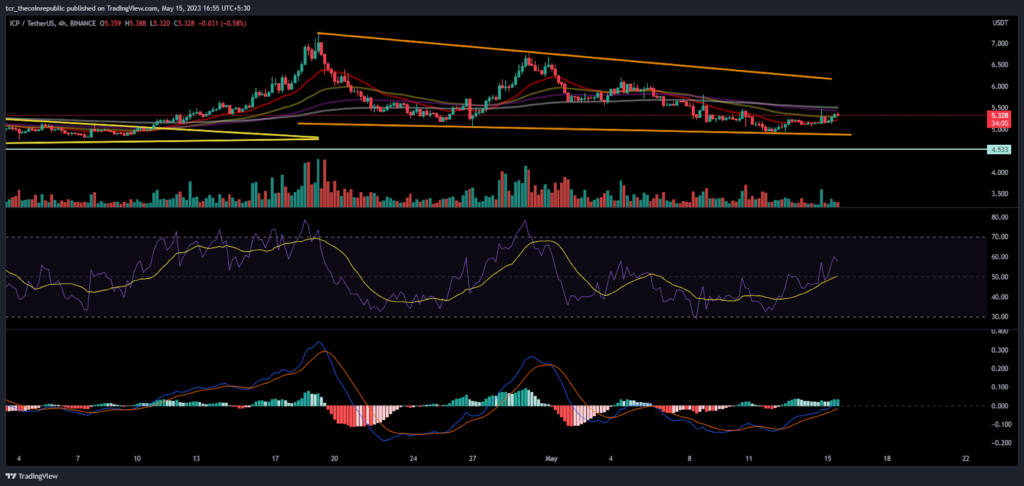
On the 4-hour chart, ICP token trading above the 50-day EMA took support and sustained on it. Moreover, the rising RSI curve shows a crossover and indicates that bulls persist in climbing the momentarily rise in price. The RSI is slowly riding towards the overbought zone above the neutrality of 60.
The MACD curve showed a bullish crossover which was still in action, and bulls took advantage of that.
Conclusion:
ICP token gradually began an up move with the rise in volumes, suggesting that investors are active on the token and making new long positions, resulting in a bounce from the support of $5.00.
Technical Levels:
Support Levels: $5.00
Resistance Level: $8.00
Disclaimer
The views and opinions stated by the author, or any people named in this article, are for informational purposes only and do not establish financial, investment, or other advice. Investing in or trading crypto assets comes with a risk of financial loss.


