

- SNPS stock trades above the key EMAs.
- Bulls are holding the gains uplifting the strength.
Synopsys stock price is showing an extensive move, increasing the momentum and sharply rising above the resistance mark of $400 in the past sessions. Moreover, the stock is breaking the multiple resistance and trading on the top at $438.
Buyers are looking in perfect shape and extending the uptrend of the stock. The price action shows that SNPS stock is above the 20-day EMA and looks bullish. Furthermore, the stock’s trajectory shows it is looking to retest the 20-day EMA to form a higher low sequence.


Synopsys, Inc. provides software products and services. The Company supplies the electronic design automation (EDA) software engineers use to design and test integrated circuits (ICs), also known as chips. The Company also offers semiconductor intellectual property (IP) products, which are pre-designed circuits that engineers use as components of chip designs rather than designing those circuits themselves.
At press time, SNPS stock was traded at $438.78 with an intraday gain of 0.25% showing buyers activity in the past sessions. Moreover, the intraday trading volume was also noted at 782.87K.
However, the stock is retracing from the top of $470 and continues to fall toward the 20-day EMA mark, which sellers are willing to do. This decremental move allowed buyers in a conservative state to rescue the muscles and sit tight on the mark to observe a sudden action.
Will SNPS retest $450?
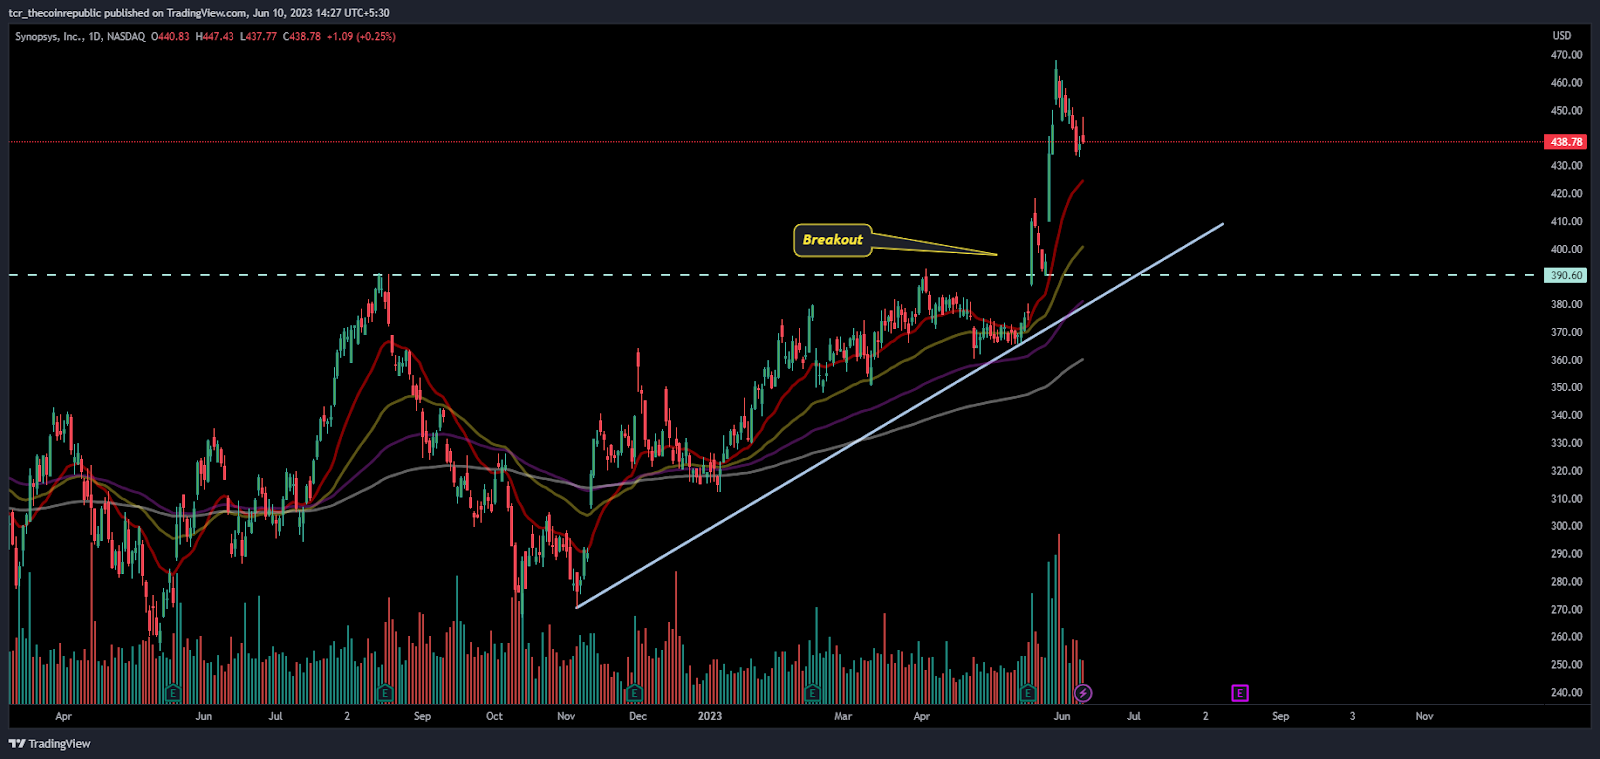
On the daily charts, SNPS stock is riding above the round level hurdle of $400, where buying activity was noted in the past week, but stock is now looking for a retracement based on the last reversal move.
SNPS stock is near the 20-day EMA and the 61.8% Fib level, which stock is looking to retest. If the stock continues to relapse from the 20-day EMA, it will target the mark of $450 to catch soon.
On the other hand, if the stock breaks below the 20-day EMA, then the stock will surely head toward $410. However, the battle between the bulls and bears is exciting..
What Technical Indicators Suggests?
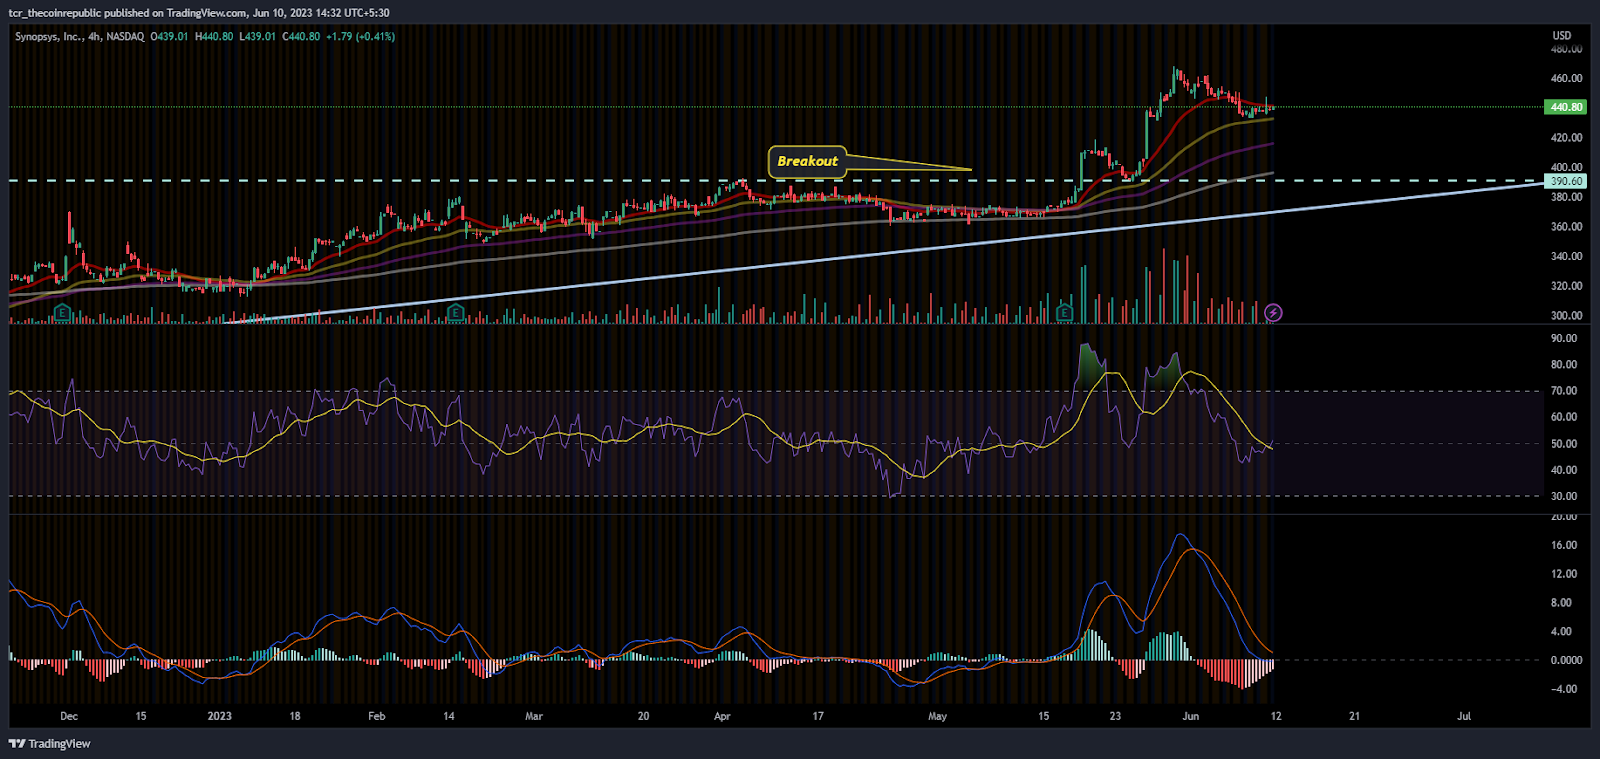
On the 4-hour chart, SNPS stock is selling over the top from $470, which has fallen by more than 10% in the last seven trading sessions. This down move from the supply mark put buyers in a conservative state, whereas the mighty bears enjoyed the down action.
The RSI is falling below the neutral mark and heading toward the selling region with a negative crossover. Furthermore, it signals the seller’s participation in the stock.
The MACD indicator shows a bearish crossover with red bars noted on the histogram.
Conclusion:
SNPS stock is volatile and intends to retest the 20-day EMA to retain the shine.
Technical levels:
Major support: $410
Major resistance: $460
Disclaimer:
The views and opinions stated by the author, or any people named in this article, are for informational purposes only and do not establish financial, investment, or other advice. Investing in or trading crypto assets comes with a risk of financial loss.


