

- ORCL stock shows an inclining move and is near the top.
- Oracle stock shows a breakout above $107 in the last sessions.
Oracle stock ( NYSE: ORCL) shows a rally in the price from the past few trading sessions riding an up move with solid momentum. The price action shows a massive inclination above the round mark of $100, and the stock is now trading above the significant moving averages and floating in uncharted territory. Moreover, the buyers are now showing their aggression and riding the gains with a strong rally in the price. As soon as the stock surpassed the range of $100, a sharp upside was noted in the price chart due to the short covering move.
Oracle Corporation (Oracle) provides products and services that address enterprise information technology (IT) environments. The Company’s businesses include cloud and license, hardware, and services. Its products and services have applications and infrastructure offerings delivered through various IT deployment models.


At press time, ORCL stock was traded at $109.86 with an intraday surge of 2.25% showing bullishness. Moreover, the intraday trading volume was noted at an increase of 4% at 12.597 Million.
Daily Charts Shows Rising Parallel Channel
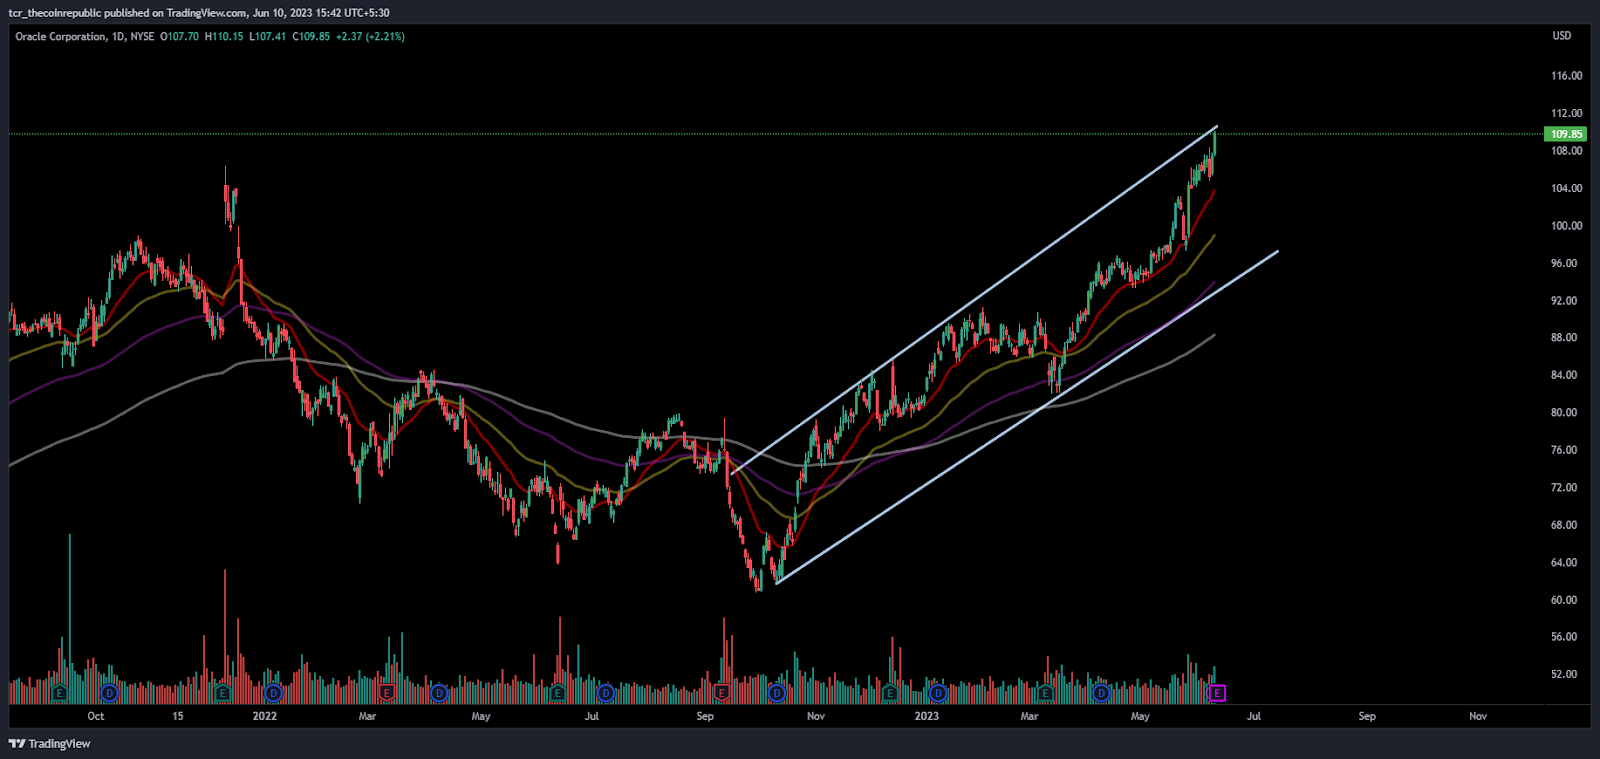
On the daily charts, ORCL stock shows a continuation of an uptrend from the start of 2023 and is unwilling to take a break. Moreover, the stock shows only buying action, and sellers are waiting for the moment when the stock is laying towards the channel’s lower trendline, but it does not happen in the past months, and buying was witnessed in the stock.
Oracle stock has been outperforming the past months and gained more than 30% in the last month. Recently, the stock gave a breakout above the round level of $100 and extensively moved beyond the boundaries.
What Traditional Indicators Say?
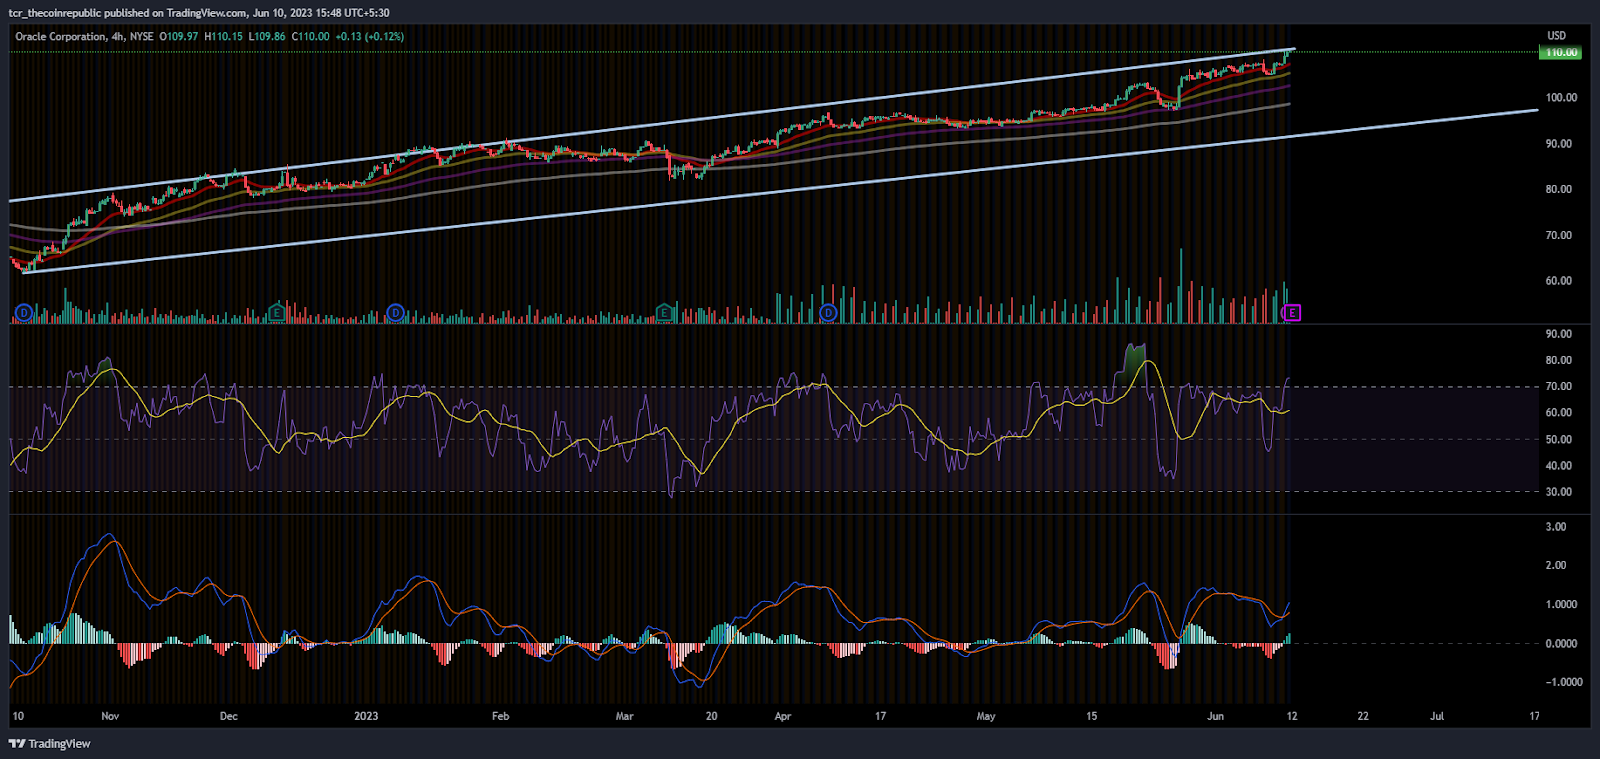
On the 4-hour charts, Oracle stock is gaining on the front and making investors charm with profits with many gains. This rise in the stock made it cross its 52-week high and made new fresh highs of $110 in the last sessions. Moreover, buyers are looking for a follow on buying in the subsequent sessions.
The RSI is floating in the overbought region, and a positive crossover was noted on the charts. Moreover, it indicates bullishness in the stock.
The MACD indicator also shows a bullish crossover, and the histogram’s green bars indicate that stock buying was noted in the last trading sessions.
Conclusion:
Oracle stock was noted with a rally and continued to extend the gains inside the rising parallel channel crossing the 52-week highs in the last trading sessions.
Technical levels:
Major support: $100
Major resistance: $116
Disclaimer:
The views and opinions stated by the author, or any people named in this article, are for informational purposes only and do not establish financial, investment, or other advice. Investing in or trading crypto assets comes with a risk of financial loss.


