

- EXPE stock shows a breakout in the last trading sessions.
- Bulls are showing their strong muscles and persist in gaining.
Expedia stock ( NYSE: EXPE) price shows a breakout of the consolidation zone and trades above the 200-day EMA, showing bullish cues and a positive outlook on the charts. Moreover, EXPE stock trades above the significant moving averages and the psychological round mark of $100, where multiple hurdles are now broken. However, there is immediate resistance at $120, which needs to be retested for a further rally in the stock.
Moreover, the EXPE stock is showing bullish sentiments and trading in uncharted territory where buyers are leading on the front and persist in delivering gains from the past trading sessions, however, after a breakout of the narrow range bound move. Buyers succeed in breaking the breadth and attaining momentum with a pullback. EXPE stock maintained the gains above the 200-day EMA and showed bullishness on the charts.


Expedia Group, Inc. is an online travel company. The Company’s segments include Brand Expedia, Hotels.com., Vrbo, Orbitz, CheapTickets, and Travelocity. The retail segment provides a range of travel and advertising services worldwide.
At press time, EXPE stock was traded at $110.48 with an increase of 2.61% showing buying perspectives. Moreover, the average trading volume in the intraday session was 3.395 Million, gaining by 1.25%. Moreover, EXPE stock on the charts is above the 200-day EMA, which shows buyers are holding their grip and maintaining strength on the charts.
Daily Charts Shows Range Breakout
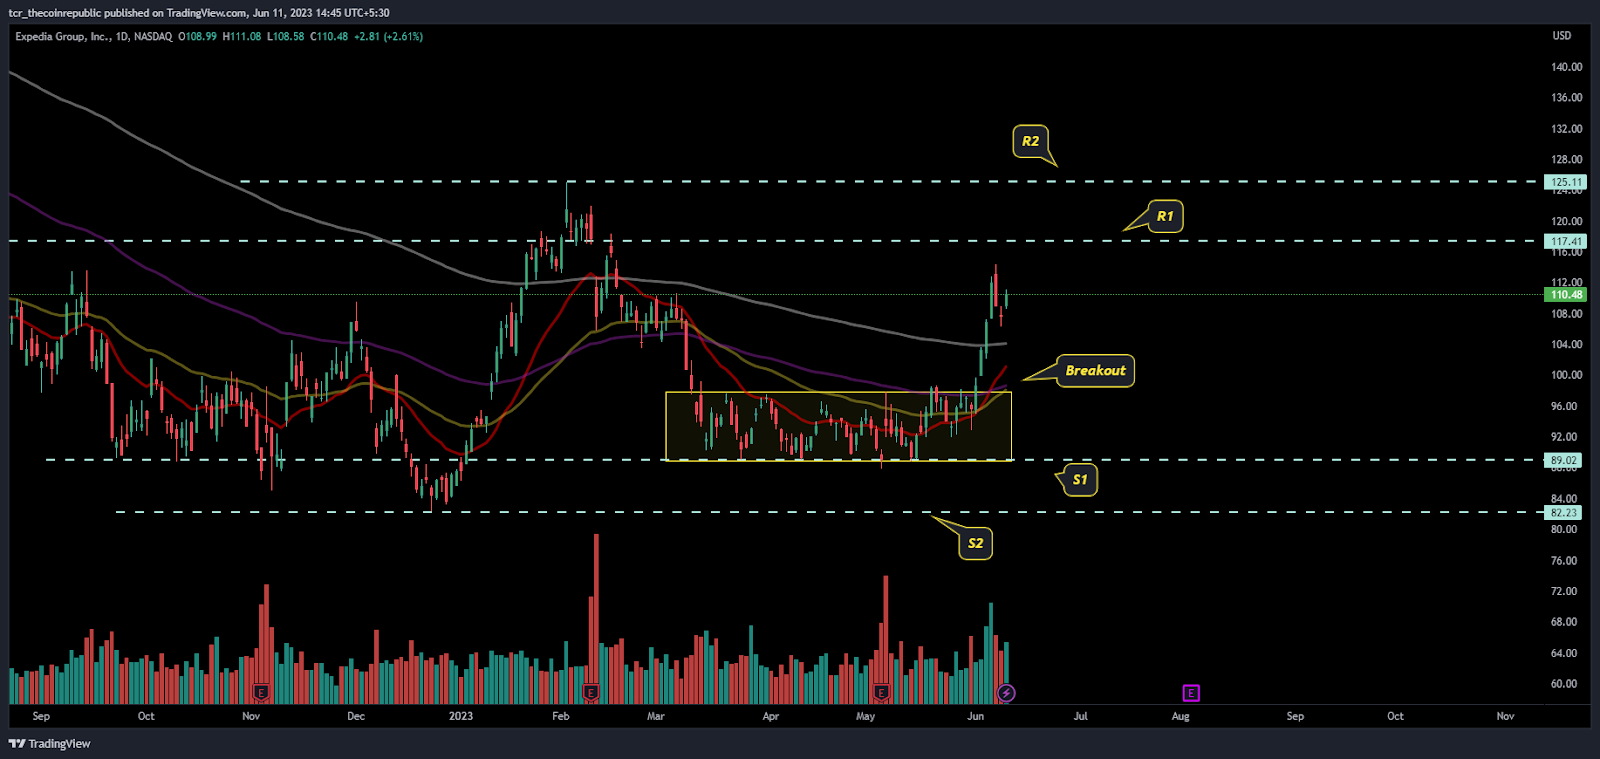
On the daily charts, Expedia stock shows bullish signals, with follow-on buying noted in the past trading sessions. Moreover, the price action shows that the stock is sustaining above the round mark of $100 and the 200-day EMA. If bulls gain further, there is an immediate resistance mark of $120 and $125, which needs to be retested.
On the other hand, if stock slips in the following sessions, then the 200-day EMA reacts as a substantial support range and follows the mark of $100.
Moreover, the EXPE stock is trading on the verge of the upper Bollinger band and is willing to fetch the highs of $120 in the subsequent sessions.
Short Term Chart Shows Sellers Participation
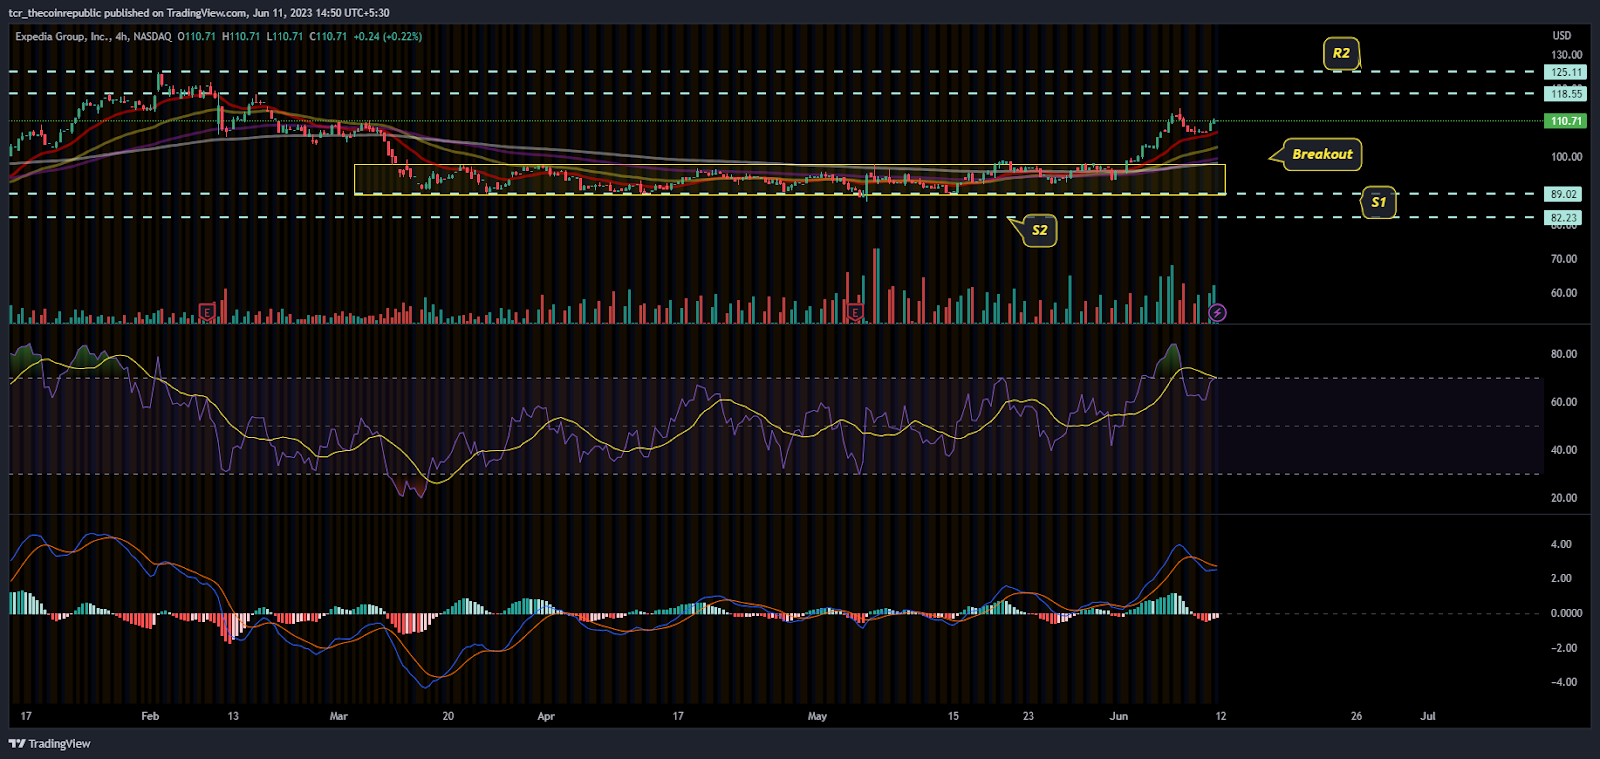
On the 4-hour charts, EXPE stock shows sellers activation on the charts and short buildup activity on the charts, but buyers, with their strong arms, attained momentum and held the gains. Moreover, the buyers also noted long buildup activity.
The RSI curve is sailing in the overbought zone and seen a retracement on the top. However, the stock holds in the buying territory and maintains the gains.
The MACD indicator is noted with a bearish crossover, red bars on the histogram, and mild correction on the top.
Conclusion:
Expedia stock continues to gain above the round mark of $100, showing bullishness on the charts.
Technical levels:
Major support: $100
Major resistance: $120
Disclaimer:
The views and opinions stated by the author, or any people named in this article, are for informational purposes only and do not establish financial, investment, or other advice. Investing in or trading crypto assets comes with a risk of financial loss.


