

- UNI token is showing a rebound from the base near $3.800
- Bulls are trying to accumulate price from the demand zone.
Uniswap token has shown their struggling face with sellers engagement in token near the demand zone of $4.000, buyers persist to hold the price near support levels. UNI token slips below the significant moving averages and try to claim 20 day EMA to attain neutrality. Moreover, the chart shows a double bottom pattern which shows that if buyers succeed to gain follow on buying above $4.50, then short covering rally will be seen and further buying can be witnessed. The neckline of the pattern is at $5.80, above that pattern activates and bulls may show strength. However, the token was under the hands of sellers and they have shown their dominance in the last few days. The price action is showing that the token is trying to leave the sellers range and willing to fetch safer horizons above $4.50.
When writing. UNI token is trading at $4.33 with an increase of 3.90%. Moreover, the pair of UNI/BTC is at 0.000166 satoshis. The intraday trading volume surged by 4.50% which shows interest of investors.


Uniswap token price succeeded to hold the intense selling pressure in the last trading session and showed a jump from the support mark of $4.000 and willing to attain pullback and meet 20 day EMA. If the token maintains to stay in the range, then buyers will accumulate in the upcoming days and raise the price to fetch the immediate mark hurdle $5.00.
Daily Charts Shows Rebound from Demand zone
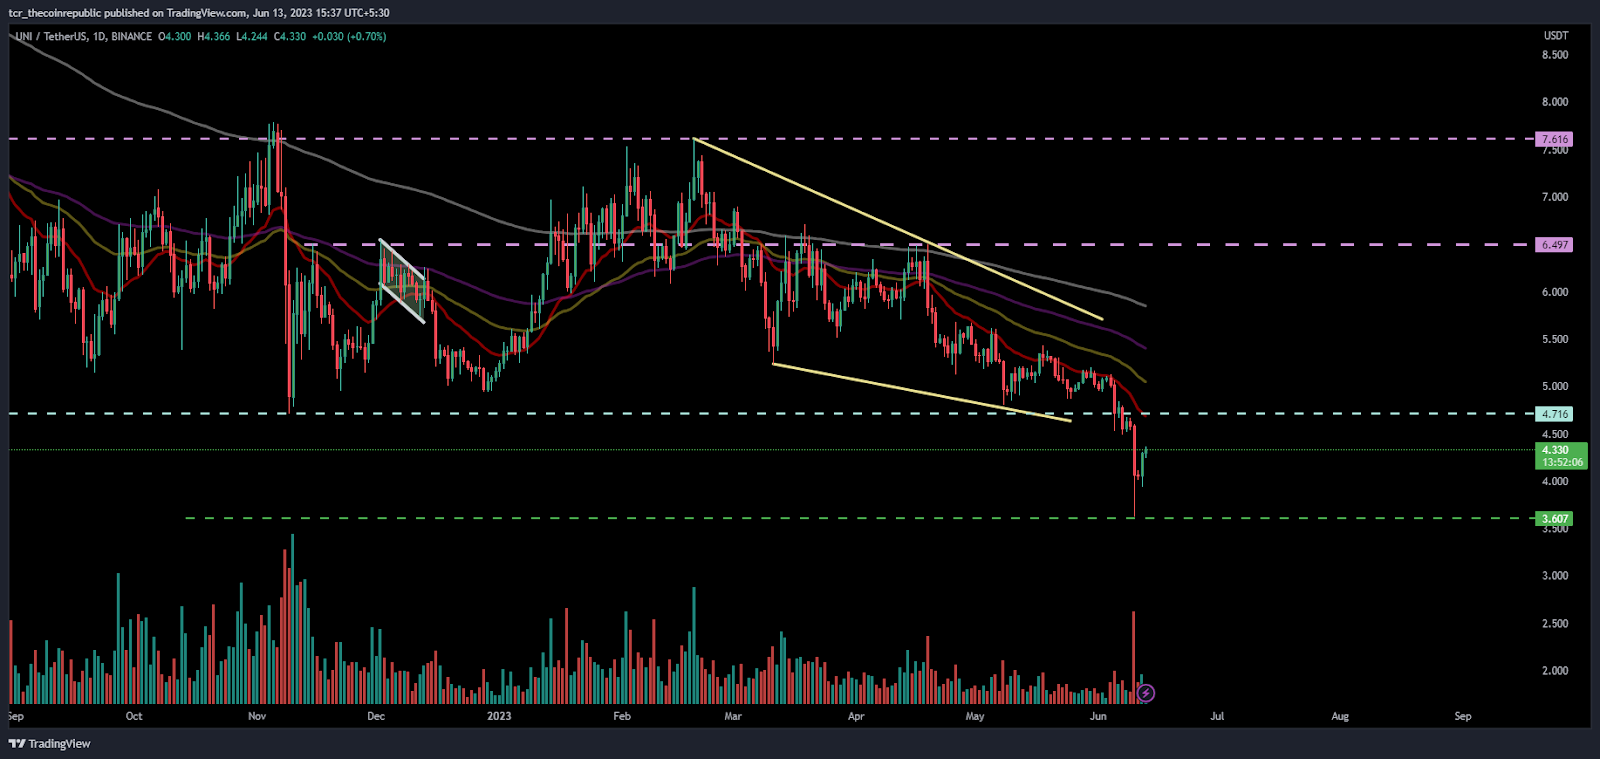
On the daily chart. UNI token was in the hands of sellers from the past week and also succeeded in retesting the demand zone, but soon buyers showed their strength and laid the strength resulting in a long wick candlestick with follow on buying showing a reversal from the bottom.
The aggressive sellers continued to make short positions and try to break the price below the support mark. The price action shows that the price has taken a reversal move from the lower Bollinger band and showed a bounce forming a morning star pattern and hammer candle in the bottom marks. However, the lower highs and lower lows sequence is shown on the chart.
As per the Fib levels, UNI token is trading below the neutrality and struggling to attain 23.6% levels which was placed near $4.50. At the moment, the price is hovering near $4.300. The token is under the sellers range where buyers are trying to leave the range and attain neutrality,which is a sign of weakness.
What Traditional Indicator Says?
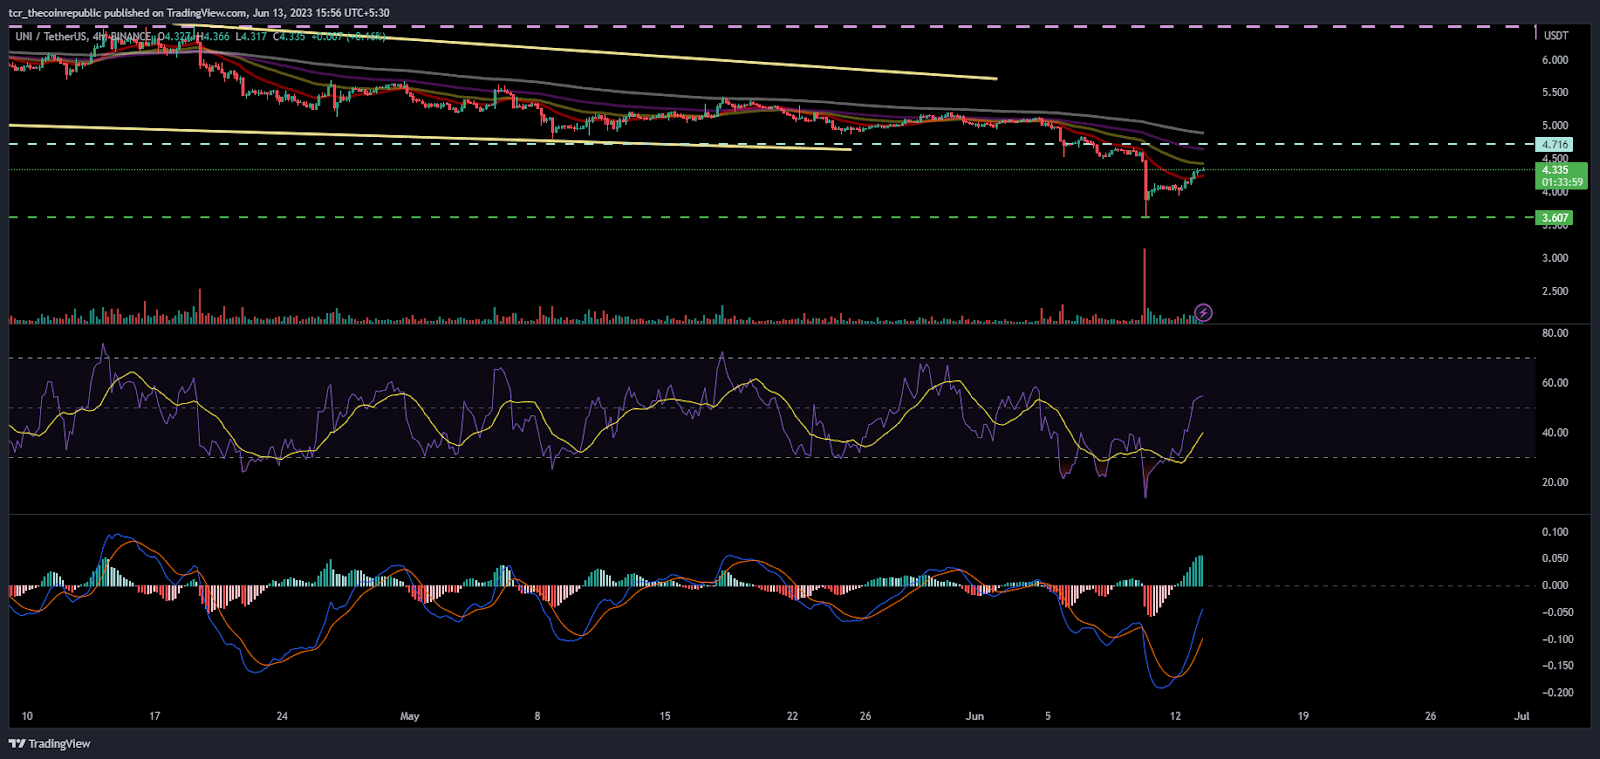
On the 4 hour chart, UNI token shows bearish cues due to the recent selling in the token. However, engagement of sellers and buyers are still in action and both are trying to gain traction.
The RSI curve shows a positive crossover which signals that buyers are trying to gain a positive outlook. The curve is above 50 gaining bullishness.
The MACD indicator shows a bullish crossover and shows green bars on the histogram.
Conclusion:
Uniswap token price showed a bounce from the demand zone in the last sessions indicating a rebound of buyers and activation of their muscles.
Technical Levels:
Support Levels: $4.00
Resistance Levels: $5.50
Disclaimer
The views and opinions stated by the author, or any people named in this article, are for informational purposes only and do not establish financial, investment, or other advice. Investing in or trading crypto assets comes with a risk of financial loss.


