
 Celestia
 Quantus
 Starknet
 Pearl
Pearl LayerZero
 Lighter
 Bitcoin
- Sofi Stock Price (NASDAQ: SOFI) faced rejection from $10.00 and lost the momentum.
- The Sofi Stock Price sustains above 50 and 200 day EMA and displays a golden crossover.
- Sofi Technologies Stock is up by 85% on YTD basis.
Sofi Stock Price (NASDAQ: SOFI) fell 17% approx after hitting the 52 high at $10.23. It faced rejection from $10.00 and showed signs of bearish trend reversal.
However, the Sofi Stock Price is still trading above the 50 and 200 day EMA showcase the trend is still in upward direction. Recently, the 50 day EMA positively intersected with the 200 day EMA which displayed a golden crossover.
In the beginning of May, Sofi Stock Price took support near $4.43 and began to recover by forming higher highs. It managed to climb above both the EMAs which triggered the positive sentiment and prices rallied 124% approx in the short span of time.
Well, In the mid of June the momentum halted near $10.00 and prices displayed a Doji candle. Sofi Stock Price is overstretched and also entered into the overbought territory. So, It witnessed minor corrections and was trying to take support near to $8.00.
Sofi Stock Price closed the previous session $8.34 with an intraday decline of -4.25%. The market capitalization stands at $7.85 Billion.
Will Sofi Stock hit a new 52 week high soon?
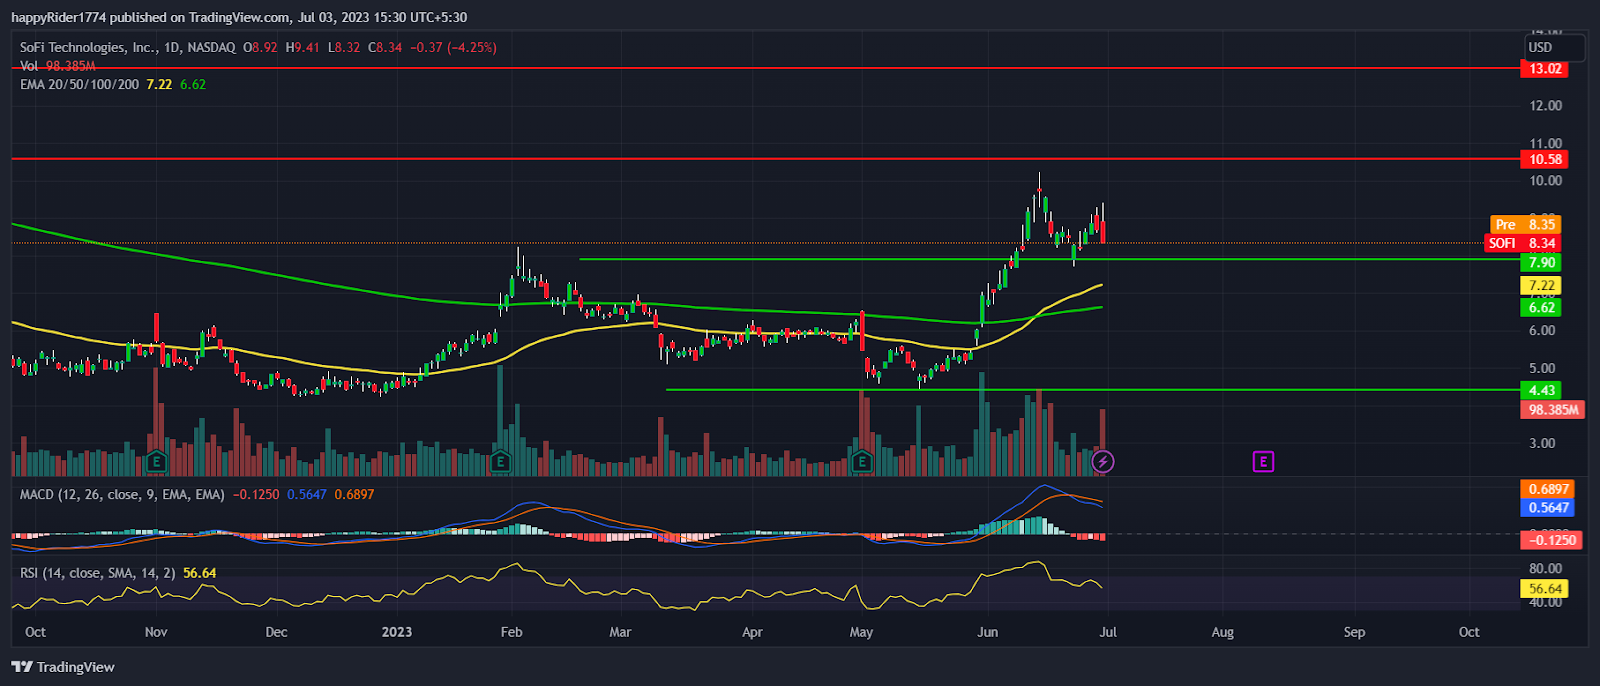
NASDAQ: SOFI daily chart by TradingView
Sofi Stock Price showed a surprising recovery from the lower levels and created hope for new highs. Till the prices are sustaining above the 50 and 200 day EMA any short term down move will be easily absorbed.
The probability of bounce back remains high but, due to the massive rally in previous month the price might enter into consolidation.
Sofi Stock Price will begin the next phase of rally only after the breakout of $10.00 hurdle level. Till then prices are expected to remain in the narrow range.
On the other hand, if the price drops below $6.00 then the trend will reverse downward and may raise concern for the investors. The technical analysis suggests, Sofi Stock Price is bullish and likely to hold the higher levels.
Sofi Stock Price Analysis on weekly time frame
Sofi Stock Price formed a long tail bearish rejection candle on the weekly time frame. It shows the presence of sellers on the higher levels. The trading volume is higher than the average volume and volatility is also high. It indicates that speculators are also active.
The MACD curve is above the zero line but generates a sharp negative crossover indicating prices likely to trade with a bearish bias. The RSI at 56 reversed down from the overbought territory.
Conclusion
Sofi Stock Price (NASDAQ: SOFI) witnessed minor correction after hitting the 52 week high at $10.23. However, till the price is above both the EMAs the trend remains in the upward direction.
The technical analysis suggests, Sofi Stock Price is bullish and likely to bounce back by taking support near $6.00 level.
Technical levels
Resistance levels: $10.58 and $13.00
Support levels: $6.00 and $4.43
Disclaimer
The views and opinions stated by the author, or any people named in this article, are for informational purposes only. They do not establish financial, investment, or other advice. Investing in or trading crypto assets comes with a risk of financial loss.




