

- Harmony (ONE) shows a huge spike of +86.71% volume resulting in $17,493,308.
- Harmony(ONE) showing signs of trend continuation by making higher highs.
- The current trading price of Harmony is $0.01338 with an advance of +4.94% in the last 24 hours.
Harmony has been rising for the last 25 days consecutively and is still continuing the momentum. It was losing crypto which recovered from lower levels and rose by +33.77% year to date.
Like other crypto, Harmony (ONE) is also a decentralized blockchain-based platform offering tools for creating, hosting, managing, and using daps with maximum scalability.


Harmony (ONE) was in a huge downtrend in the long term but recently started to rise by showing some change in the structure of the market in smaller time frames and started to make new higher high structures by breaking the existing swing lows.
This behavior in the market indicates the presence of buyers and the losing interest of sellers and if buyers are able to dominate the trend successfully then in the upcoming days we can see a change in the trend and the formation of new higher highs in Harmony (ONE).
Harmony (ONE) Technical Analysis
EMA
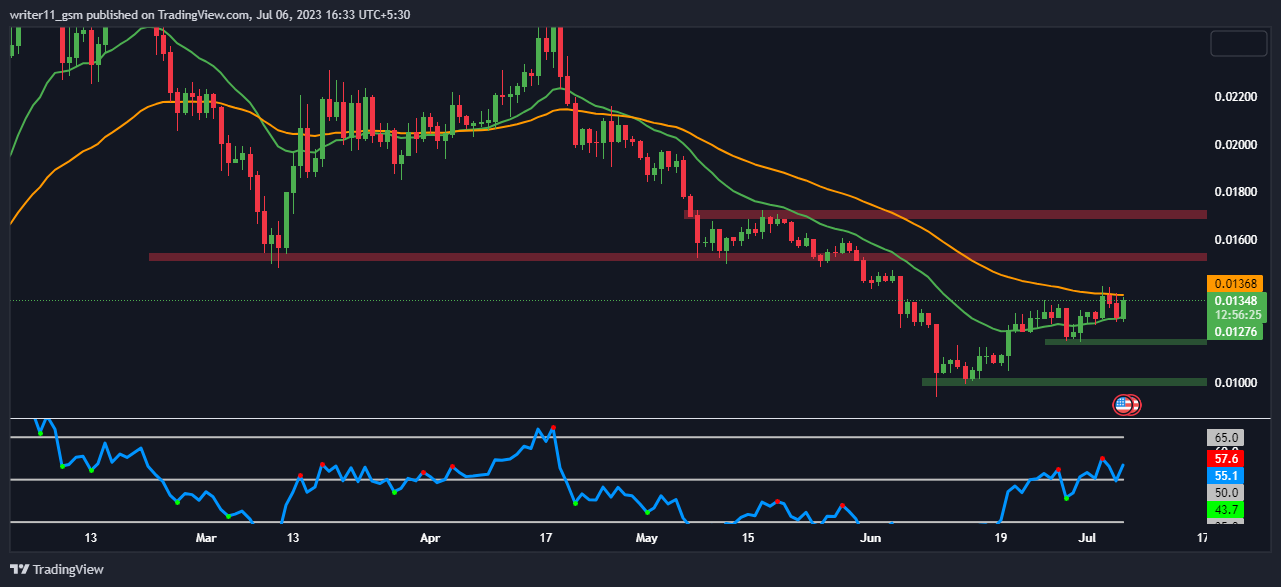
Based upon the current charts the market is trading below the 50-day Exponential moving average but is trading above the 20-day Exponential moving average and also is taking support at the same and moving upwards which represents bullishness in the market.
ONE is taking rejection from the 50-day Exponential moving average. However, Harmony took the support at the 20-day Exponential moving average and is currently preparing to break the 50-day Exponential moving average which can represent a change in trend as this move will lead to a bullish crossover and start of a new bullish trend.
RSI
The RSI was trading below the oversold zone for a long time but it has recently travelled to the 54 level and has also taken support at the level of 50 which represents strength in the market denoting the presence of buyers.
Market Structure
Harmony (ONE) was consecutively falling from the higher levels and made a low of 0.00937 but in recent times from the last 25 days it is showing strength by consecutively rising and making new higher high swings in the market. This indicates that the trend of the market has changed in a smaller time frame and the continuation of this momentum can lead to a major trend after which we may get to see new higher levels and a bull run in Harmony.
Conclusion
Considering the Exponential moving average we can see that the market is trading above the Harmony is trading above 20-day Exponential moving average and is about to break the 50-day Exponential moving average, also the RSI is trading above the 50 levels and the crypto is making higher highs on the smaller time frame such as 1D. Also, there has been a spike of +86.71% in trading volume in the last 24 hours.
Technical Levels
- Support Level – 0.1867 and 0.1577
- Resistance Level – 0.01527 and 0.01707
Disclaimer
The information provided in this article, including the views and opinions expressed by the author or any individuals mentioned, is intended for informational purposes only. It is important to note that the article does not provide financial or investment advice. Investing or trading in cryptocurrency assets carries inherent risks and can result in financial loss.


