

- RXRX Stock Price (NASDAQ: RXRX) soars 78% and hits a 52 week high at $14.99.
- Recursion Pharmaceuticals Stock attempts to break the $14 swing high hurdle.
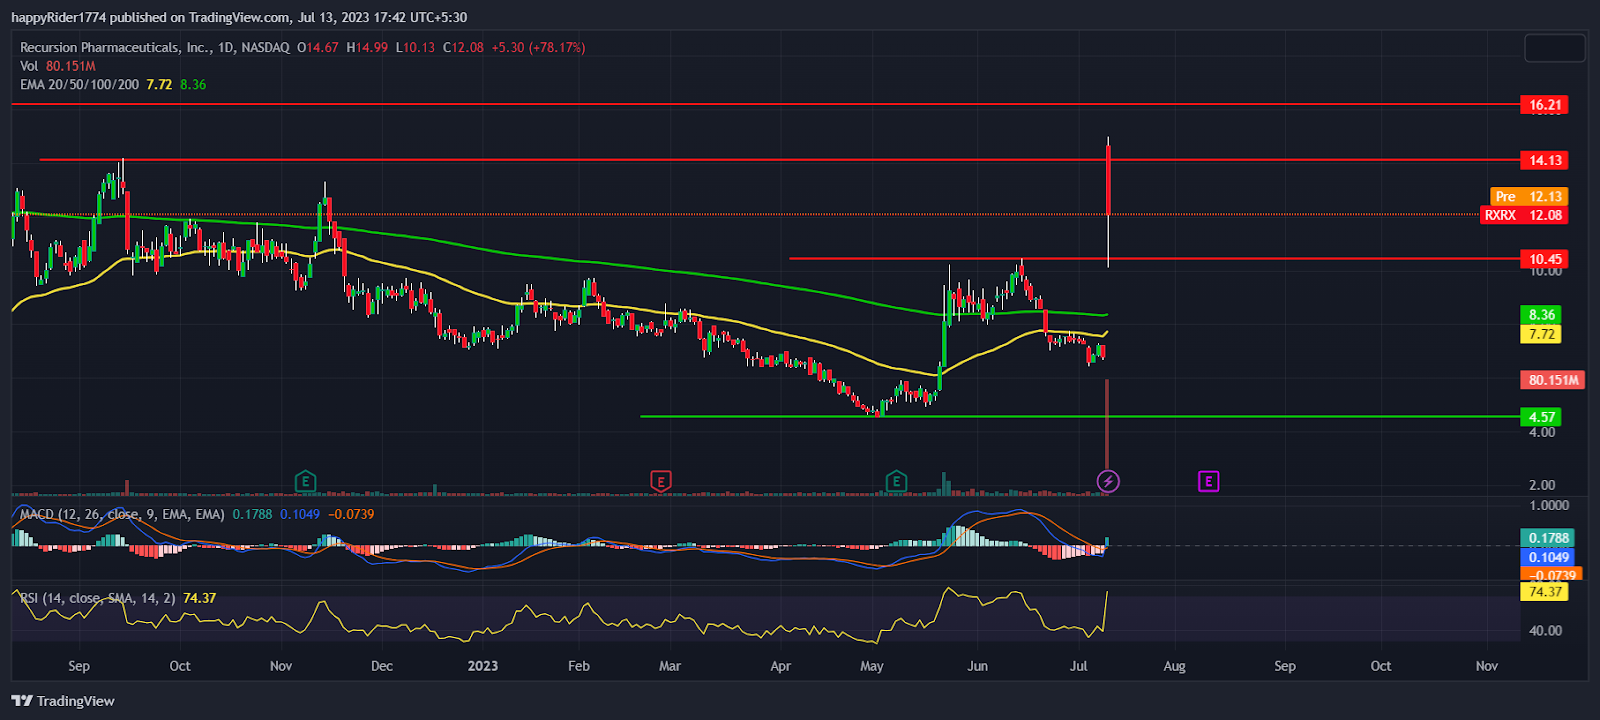
- RXRX Share Price breaks the 50 and 200 day EMA with a wild gap.
RXRX Stock Price (NASDAQ: RXRX) surges 78% in a single day and breakout of the swing high hurdle. In the previous session prices showed a wild gap up which triggered a short squeeze.
Recursion Pharmaceuticals Stock witnessed a massive surge in the volume. The reason might be short covering or fresh buying. The stock prices climb above the 50 and 200 day EMA indicates the bullish trend reversal.


Well, the price is near to the overbought territory so, minor consolidation or retracement is possible.
In the beginning of May, RXRX Stock Price took support near $4.57 and showed a decent bounce from the lower levels. At the same time, the quarterly earnings were released which further fuels the rally in the stock.
RXRX Stock rallied 107% approx in the short span of time. The momentum halted near $10.00 and prices entered into consolidation.
In the mid of June, Stock prices witnessed profit booking and slowly dropped below both the EMAs. Well, the recent up-move has recovered the losses which grabbed the attention of long term investors.
RXRX Stock Price closed the previous session at $12.08 with an intraday rise of 78.17%. The market capitalization stands at $2.81 Billion.
Will RXRX Stock Price fill the gap?
RXRX Stock Price took a sharp U-turn and showed a steep rise. The prices retested the breakout level and buyers succeeded in defending it. The next few sessions will be volatile but narrow range consolidation is expected which will bring stability in the prices.
Till RXRX Stock holds the $10.00 level the prices are expected to remain in the bulls grip. The prices might try to retrace down to test the EMAs but it is likely to bounce back.
On the other hand, if the price drops below $10.00 then the up move will be considered as a bull trap. The next phase of the rally will trigger when buyers are able to break out of the $15.00 hurdle.
RXRX Stock Price Analysis on weekly time frame
RXRX Stock Price formed a strong bullish candle on the weekly time frame. The stock is turning bullish on multiple time frames. The bulls are aggressive and seem to be returning back to track.
The MACD curve displayed a sharp positive crossover and histogram bar turned green indicates prices are likely to trade with bullish bias. The RSI at 74 sloping upward denotes strength but prices have entered into the overbought territory.
Conclusion
RXRX Stock Price (NASDAQ: RXRX) surges 78% in a single day and displayed a massive breakout. The trend of Recursion Pharmaceuticals Stock has reversed upward.
The technical analysis suggests, the recent rally is speculative and prices might face rejection on higher levels.
Technical levels
Resistance levels: $15.00 and $16.00
Support levels: $10.00 and $8.00
Disclaimer
The views and opinions stated by the author, or any people named in this article, are for informational purposes only. They do not establish financial, investment, or other advice. Investing in or trading crypto assets comes with a risk of financial loss.


