

- EOS price prediction shows that the price has been on a selling spree.
- The crypto price lost 38% in the last year.
- The token is trying to test the resistance of $0.832
EOS’s (EOS) price prediction shows that the market has been on a selling spree ever since it started falling from its all-time high. The market is under strong bearish influence, which has led to falling prices. The selling pressure led the EOS token to carve new lows, which is a concerning factor for any asset. The market began a sharp descent after getting rejected at the resistance of $1.277. The bears took control and the price plunged by 52% to a new all-time low of $0.600.
At the time of writing, the current market price of EOS tokens is $0.745. The 24-hour trading volume surged 23%%. The market is down 3.46% in the last 24 hours. The overall market cap of EOS is $817,990,873.


Can EOS Break the Resistance to the Upside?
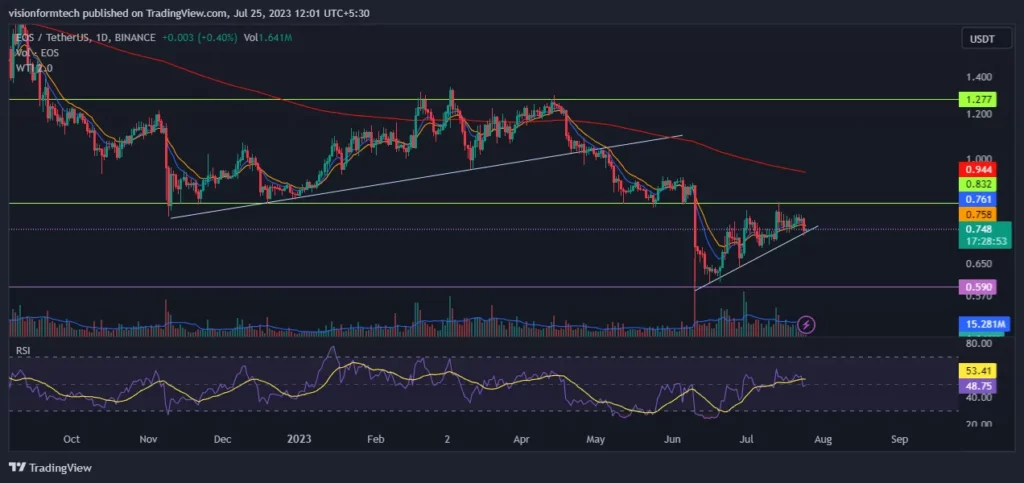
EOS’s price prediction reveals that the price declined after breaking a bear flag in May 2023. The EOS price is 22% below the 200 EMA. This signifies the bearish dominance of the market. The EOS token price is driven by fear. The market consists of trapped investors who bought at higher prices and are afraid to hold on.
The selling pressure is due to such investors who want to exit with the minimum loss and would sell every time the price rose. However, the EOS crypto price made a recovery of 38% to the resistance level of $0.832 from its all-time low. The sellers maintain a stronghold at the resistance, and it won’t be easy for the bulls to break past this level.
Short-Term Chart Shows a Minor Uptrend
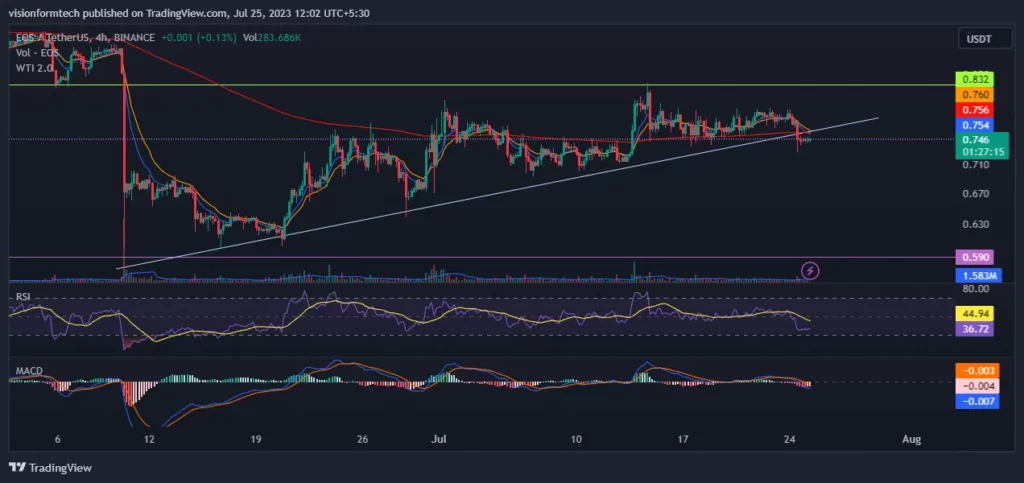
The 4-hour chart indicates that the price is in a minor uptrend. The price has been making higher highs and higher lows. The EOS token is taking a bounce from an ascending trendline as the EOS crypto price climbs. The price is consolidating after getting a correction from the resistance.
The price is moving around the 9, 15, and 200 EMAs, and the EMAs are moving flat. This is a sign of a sideways market. However, the price is breaking the ascending trendline. It indicates that the price may start declining again. If the price breaks down, the market may fall to new lows.
RSI
The RSI indicator is currently at 48.31. It represents bearish to sideways conditions where the price may continue to fall until RSI exceeds 50. Aggressive selling may happen only if RSI goes below 30
MACD
MACD has made a bearish crossover and the indicator has crossed the 0 line. This is an indication that the price may start declining aggressively in the short term.
200 EMA
On the 4-hour chart, the price is moving around the 200 EMA. This is a sideways market condition. It means that the trend is unclear and it would be wise to wait for the price to move away from the indicator to establish a clear trend.
Conclusion
EOS’s price prediction shows that the market has been on a selling spree ever since it started falling from its all-time high. The journey from the all-time high to the all-time low has caused distress among investors. The overall trend looks bearish, and it won’t be wise to catch a falling knife. Therefore, it would be wise to wait for a concrete sign of reversal and consider investing. At present, the best way to deal with this situation is by using proper risk management.
Technical Levels
- Support Level: The nearest support level is $0.600
- Resistance Level: The nearest resistance level is $0.832
Disclaimer
The views and opinions stated by the author, or any people named in this article, are for informational purposes only and do not establish financial, investment, or other advice. Investing in or trading crypto assets comes with a risk of financial loss.


