

- Render price (RNDR) slid 0.04% in the last 24 hours and is currently trading at $1.75.
- Render (RNDR) whales data states that whales hold a total of 46.33% with a significant decrement of 22% over the past 1 year.
RenderToken (RNDR) is a network that uses the Ethereum blockchain to let artists and studios access GPU rendering power from miners who rent out their GPUs. It was created by OTOY, inc. CEO Jules Urbach in 2009 and launched in 2017, with its first public token sale in October 2017.
The Render price is currently trading at $1.75 with a decline of 0.04% in the past 24 hours. RNDR holds a total market cap of $648.95 Million and ranks 62nd in the crypto market.


RNDR token has a trading volume of $13.93 Million with a decline of 16.87% over the past 24 hours. It has over 369.6 Million tokens in circulating supply. The volume-to-market cap ratio of the RNDR token is 2.15% indicating low volatility in the market.
Render Price Prediction Using Price Action Strategy
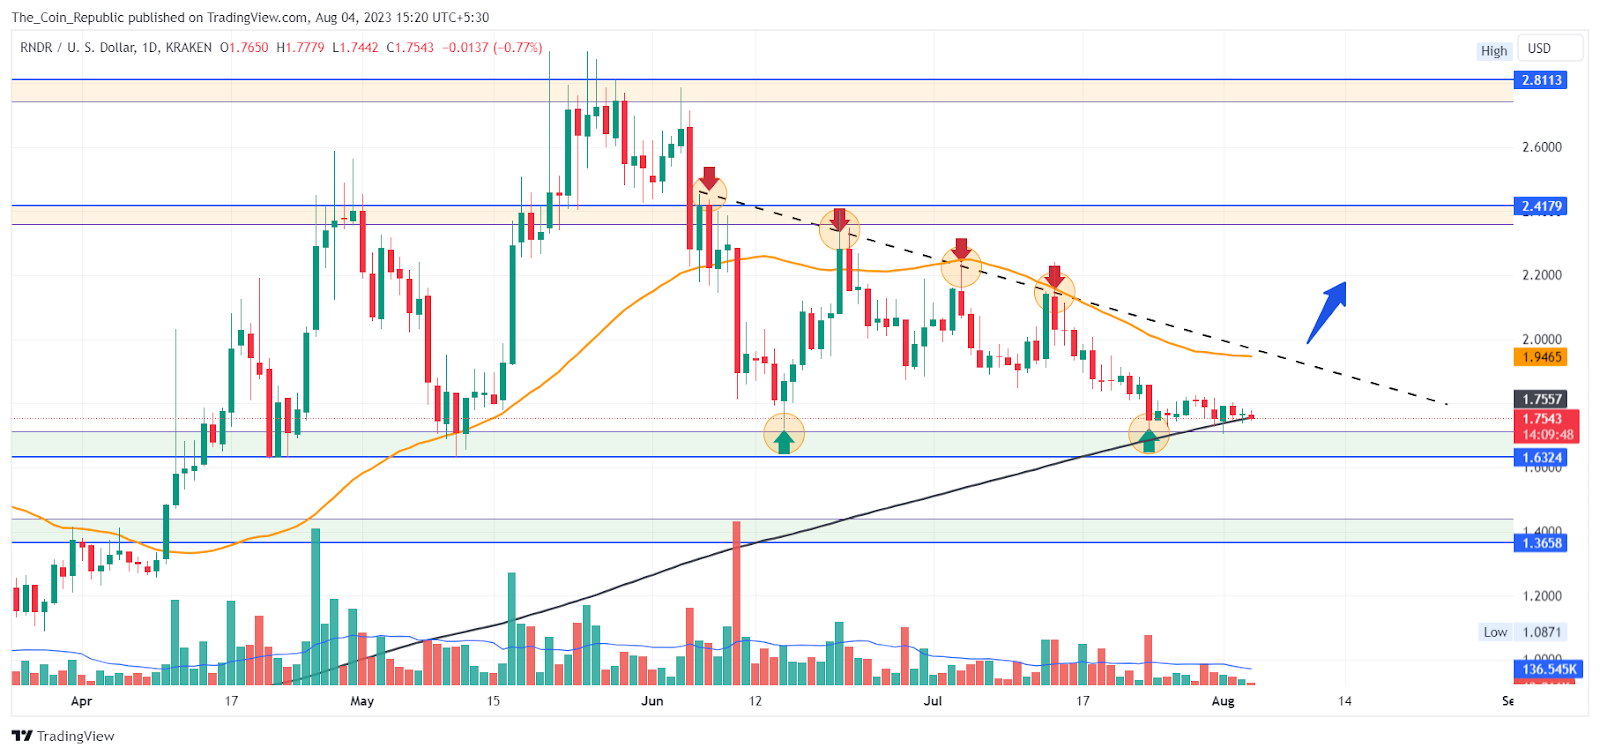
Render price analysis reveals that the token price topped out in June 2023 and declined after forming a double-top pattern. Thereafter, the price entered a correction phase and formed lower highs.
Moreover, the price seemed to be suffering rejection from upper trendline resistance and declined.
Currently, the price is struggling to sustain near 200 EMA from where it may get buyers’ interest and surge higher.
However, if the price fails to sustain above the 200 EMA it may slip to lower support zones.
RNDR Price Forecast from Indicators’ point of view
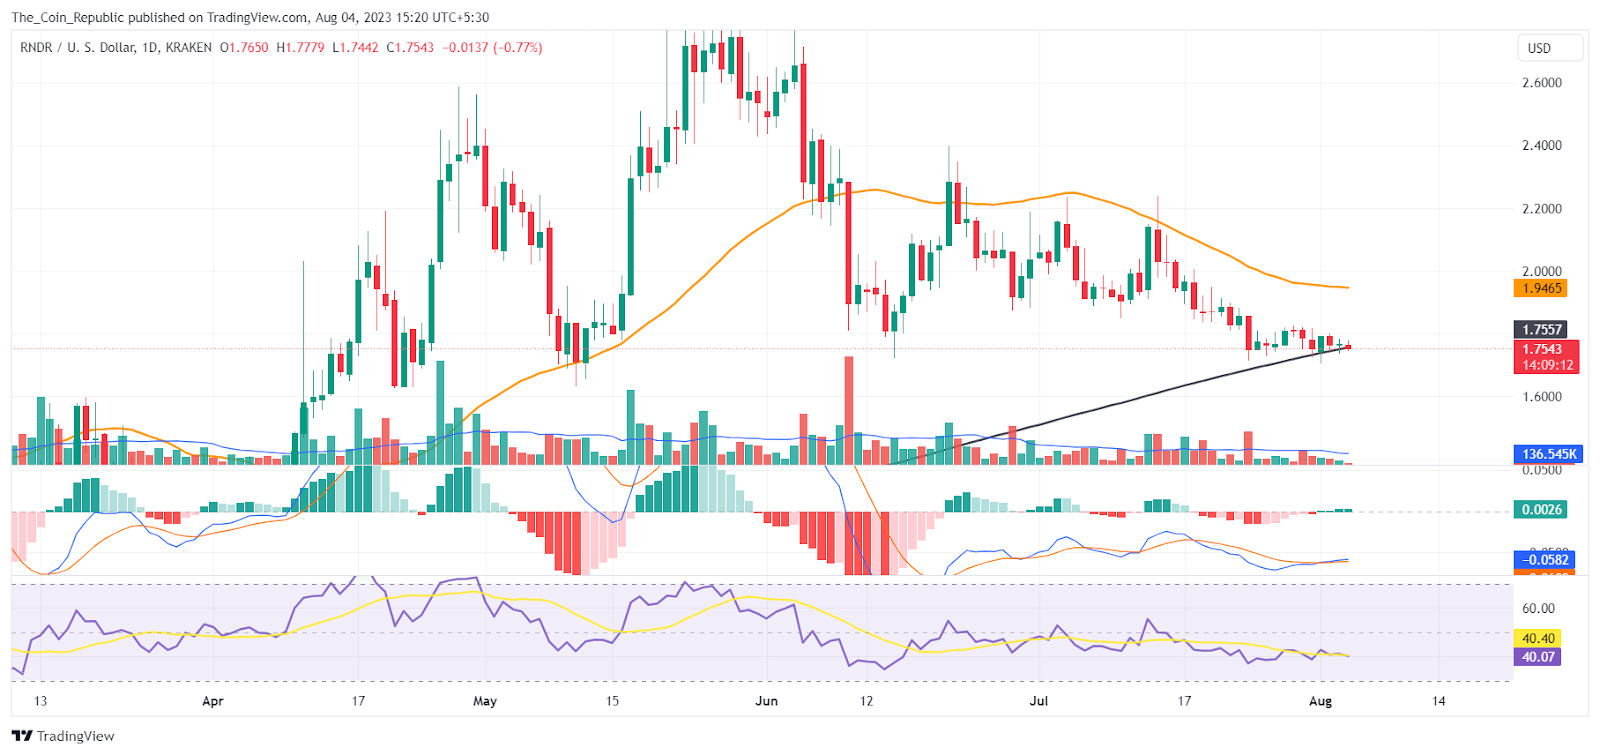
As per the EMA analysis, the RNDR price suffered rejection from 50 EMA. Currently, the price is trading near 200 EMA and trying to sustain above it. If the price fails to do so then it may slip to lower support levels.
At the time of publishing, the RSI value of the RNDR token is 40.12 and that of the SMA line is 40.40. RSI has gone flat which shows that the price has undergone a consolidation phase.
MACD lines have made a bullish crossover. However, histogram bars are being formed above the mean line showing a neutral to bullish sentiment in the market.
Conclusion
Render price prediction concludes that the token Render price analysis shows that the token price peaked in June 2023 and fell after making a double-top pattern. The price then entered a correction phase and made lower highs. They faced resistance from an upper trendline and dropped. The price is trying to stay near 200 EMA, where it may get buyers’ support and rise again. But if the price breaks below the 200 EMA, it may slide to lower support levels.
Technical Levels
- Support levels: $1.632 and $1.36.
- Resistance levels: $2.41 and $2.81.
Disclaimer
The views and opinions stated by the author, or any people named in this article, are for informational purposes only and do not establish financial, investment, or other advice. Investing in or trading crypto or stock comes with a risk of financial loss.


