

- At press times, ADA/USD is trading at $0.2939, 92% down from the high it printed in August 2021 of $3.10.
- Hidden bullish divergence on weekly charts can be seen
- How ADA has entered into a sideways trend and how to encounter it as a trader.
ADA Price Analysis
Cardano (ADA) focuses on creating a more transparent, secure, and fair society. Also, the token is designed to ensure that owners of this token can participate in the operation of the network. Owners can also have voting rights on the platform.
ADA PRICE ANALYSIS (WEEKLY)
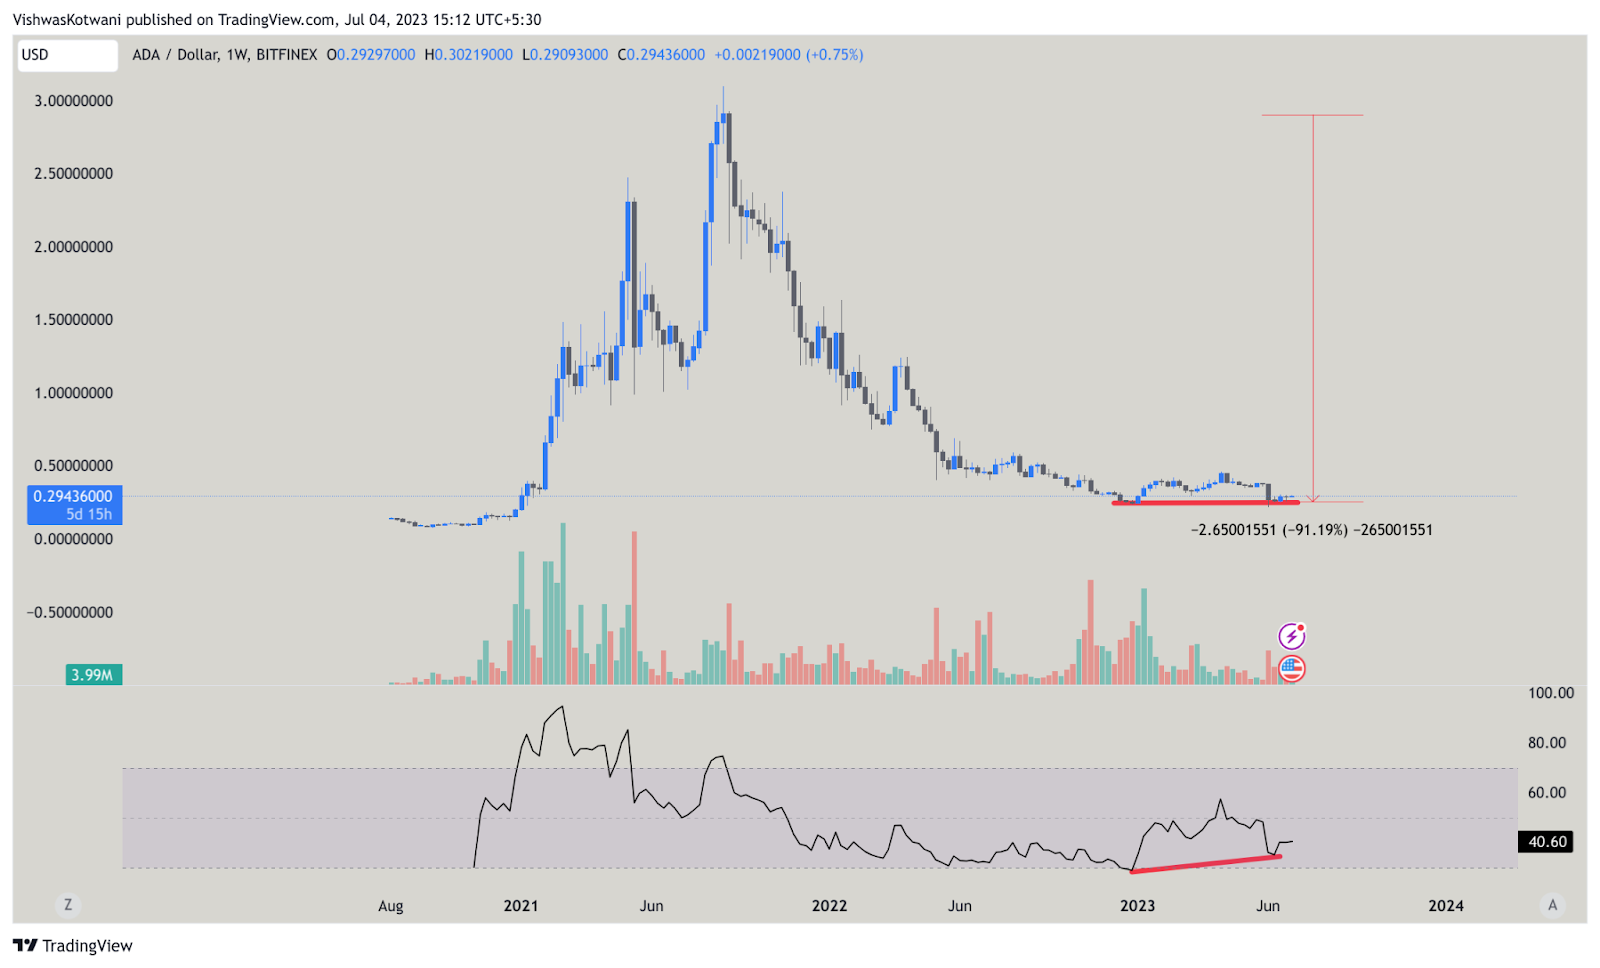
The price of ADA token is 92% down from the all-time highs. The volumes initially were higher but have decreased while the trend has turned sideways. This indicates that the sellers have exhausted and a fresh buyer has returned.


The ADA price has to cross above $0.3787 for the buyers to show strength. Above the resistance level of $0.3787, a new target and the next immediate resistance level of $0.4489 will open up.
Bears will have the upper hand until the price stays below $0.3787. However, a bullish divergence where the price is making a constant low, whereas the RSI is making a higher high, is on the charts.
ADA August Price Action Indicates Trend with Support at $0.2559 and Resistance at $0.3787.
A breach on any side will indicate a trending move toward the breakout.
ADA PRICE ANALYSIS (DAILY)

The ADA price seems to be in a triangle formation on the daily time frame, descending. It forms lower highs by taking resistance on downward-sloping trend lines and with constant lows. The resistance and support lines are marked on the chart.
An upside breakout of the trendline will activate the next resistance level, which is $0.3457. If the price breaks the support line and starts trading below $0.2563, the price will find next support around $0.2231.
ADA PRICE ANALYSIS (4HR)
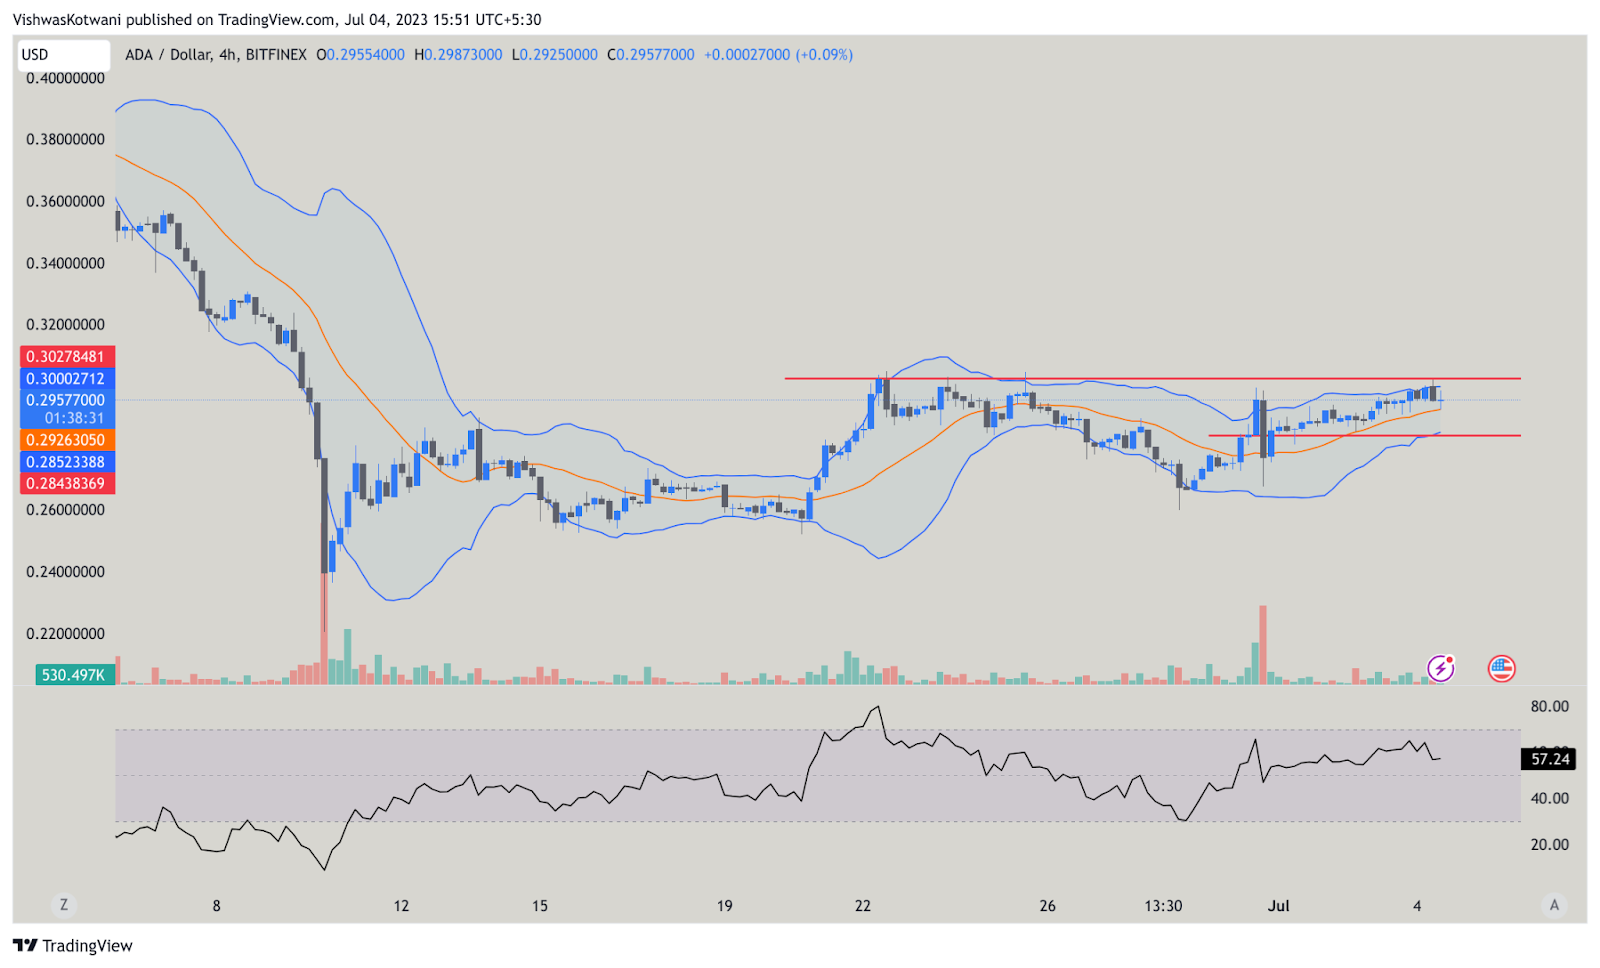
On a shorter time frame, 4 hours, the Bollinger band is squeezing, which means the volatility is contracting. The upper Bollinger band can be marked as resistance and the lower as support. A break on either side of the channel will give a trending move in the direction of the breakout.
Conclusion
The RSI on the daily chart is trading at the 50 mark. It has bounced off from the oversold territory. For further up move, it has to sustain above the 50 mark. The ADA midpoint will also act as a resistance for the RSI.
KEY TECHNICAL LEVELS:
- Upper Bollinger Band: $0.3000
- 20 Moving Average Line: $0.2926
- Lower Bollinger Band: $0.2852
Disclaimer
The views and opinions stated by the author, or any people named in this article, are for informational purposes only and do not establish financial, investment, or other advice. Investing in or trading crypto or stock comes with a risk of financial loss.


