

- BHC’s price was $226.52 last week and is currently at $284.08.
- Bitcoin Cash is the Cash Version of Bitcoin, Designed for Everyday Transactions
- Bitcoin Cash’s Price Surges with EDX Market Listing, Bridging the Gap Between Traditional Finance and Crypto.
Current BCH Price
The current price of Bitcoin Cash stands at $284.08 per BCH/USD, with a market capitalization of $5.52 billion. The 24-hour trading volume for Bitcoin Cash is $745.52 million. The price of BCH in USD is updated in real-time. Over the last 24 hours, Bitcoin Cash has experienced a decrease of 3.73%. The circulating supply of Bitcoin Cash is 19.44 million.
Factors Influencing BCH’s Future
Expanded Block Size:


Bitcoin Cash implemented a larger block size compared to the original Bitcoin blockchain. With a block size of up to 32MB, Bitcoin Cash can accommodate over 25,000 transactions per block and confirm approximately 100 transactions per second. This scalability improvement allows faster and more cost-effective peer-to-peer transactions, with fees as low as a fraction of a cent.
Smart Contract Capabilities:
Unlike the original Bitcoin blockchain, Bitcoin Cash has incorporated intelligent contract functionality. Using CashScript, a specialized innovative contract language, developers can create applications and deploy smart contracts on the Bitcoin Cash network. Additionally, the introduction of SmartBCH, a Bitcoin Cash side chain compatible with Ethereum’s EVM, enables the development of innovative contract applications within the Bitcoin Cash ecosystem. SmartBCH utilizes a Proof of Stake consensus mechanism and high throughput to ensure low transaction fees, even with a large user base.
Market Demand and Adoption:
Bitcoin Cash’s (BCH) price is influenced by its market demand and adoption. Increased usage and acceptance of BCH by merchants, businesses, and individuals can drive up its direction and potentially increase its price.
Bitcoin Market Performance:
As a prominent fork of Bitcoin, the performance and market trends can impact the price of Bitcoin Cash. Positive movements in the Bitcoin market, such as price rallies or increased investor sentiment, can often spill over to BCH and contribute to its price movement.
Network Upgrades and Technological Developments:
Improvements and upgrades to the Bitcoin Cash network can impact its price. Enhancing scalability, security, and functionality may attract more users, developers, and investors, increasing demand for BCH and potentially driving its price upward.
Technical Analysis of Bitcoin Cash
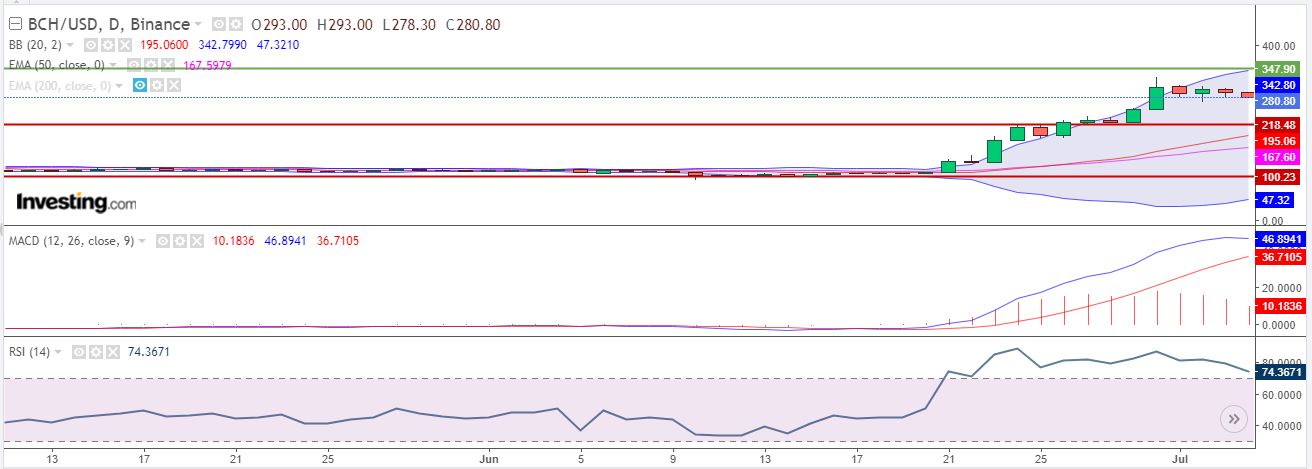
Breaking Out: Recent Surges and Growth
EMA (Exponential Moving Average)
On the 1-day time frame, Bitcoin Cash is currently exhibiting a bullish trend. The 50-day moving average is sloping upwards and positioned below the current Bitcoin Cash price, potentially serving as a support level during future interactions.
Furthermore, the 200-day moving average for Bitcoin Cash is also trending upwards since June 4, 2023, indicating a robust overall trend. The 200-day moving average currently resides below the price, suggesting that if the price interacts with it again, it could act as a support level, supporting the continuation of the bullish trend.
RSI (Relative Strength Index)
Currently, the RSI is above the 30-70 neutral zone, which indicates the price is trending overbought, with the cost being able to keep RSI in that state for a while.
If more indicators indicate overbought, then there is a chance of a reversal in the price.
MACD (Moving Average Convergence/Divergence)
On the histogram side, there is neither a bearish nor bullish divergence, which could also mean the price will reverse.
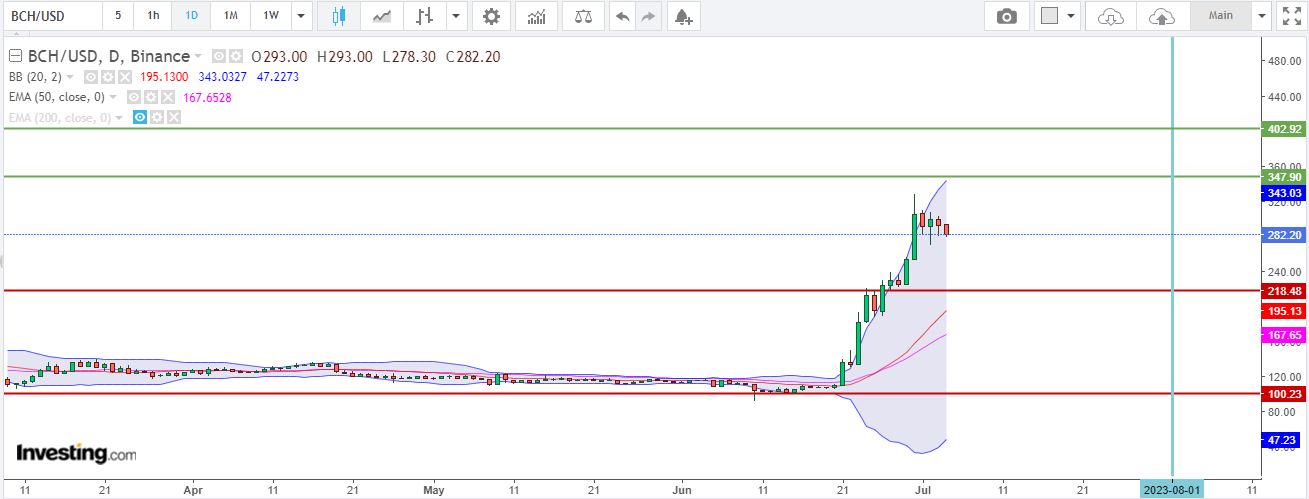
Price Prediction For August 2023
BCH’s long-term Price Prediction is a look at BCH’s with regard to price. While writing this article, BCH currently stands at $284.08, with a market cap of $5.52B and trading volumes of $ $745.52M.
Due to a recent price breakout, it becomes challenging to identify specific levels for future price predictions. High momentum and volume create a dynamic market environment that can make it difficult to establish precise price levels.
Conclusion
Considering the bullish nature of both the 50-day and 200-day moving averages, if we were to provide a Bitcoin Cash price prediction on the 1-day time frame, it would be bearish, indicating the potential for a downward price movement.
Its Technical levels for August 2023 can be as follow
Resistance Levels – Around $347.90 to $402.92
Support Levels – Around $218.48 to $100.23
Average Level – Around $283.19
Disclaimer
The views and opinions expressed in this article are provided for informational purposes only. They should not be construed as financial or investment advice. Investing in or trading crypto assets carries a risk of financial loss.


