

- PFC is currently trading at $80.15.
- PFC price is currently continuing its uptrend.
Petrofac was founded in 1981 by Ayman Asfari and Maroun Semaan. its current CEO Tareq Kawash was appointed on 1 April replacing the ex-CEO Sami Iskander. Petrofac Ltd deals with the provision of services to the oil and gas production and processing industry.
Currently, the workers of Petrofac Ltd have voted for a strike action in a dispute over the jobs, pay, and working conditions said by the UK’s Unite which could lead to a fall in the price of the Petrofac stock.


Price of Petrofac to Rise or Fall in Future ?
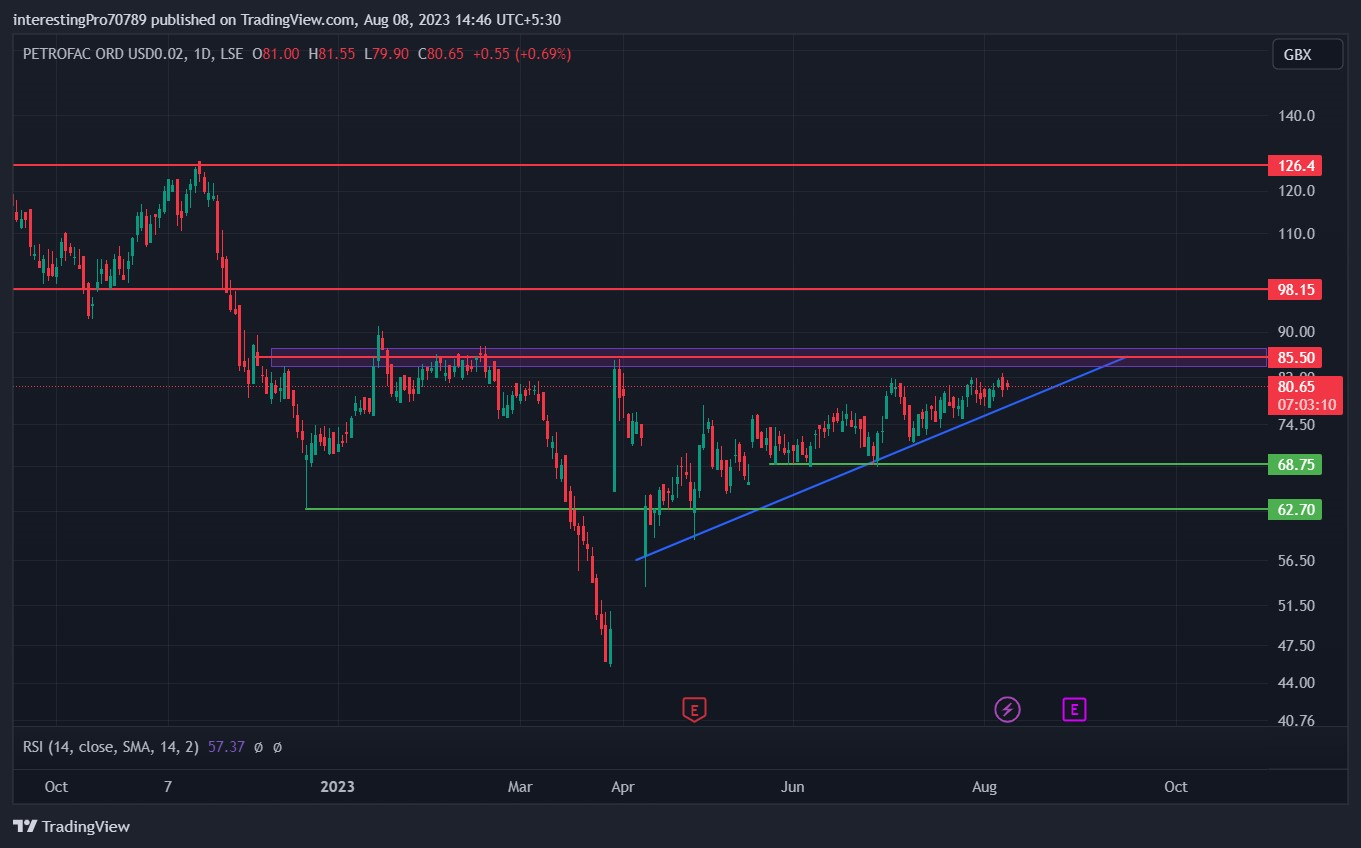
In December, the PFC formed a support of $62.70 and showed a bullish rally till $85.50. It closed above the $85.50 level, but PETROFAC Stock price faced a heavy rejection from that level and it fell to $45.38. The next day price opened near the same level from where the price faced rejection last time and again faced rejection from that level making $85.50 a strong resistance level. After getting rejected from the $85.50 resistance, the price opened gap down at $57.10 and showed a bullish rally again with a trendline support. Currently, the price is trading just below the $85.50 resistance level; so now, the price is trading at a very crucial level. If the price manages to give a breakout of the $85.50 resistance level and sustains over it, then the price of Petrofac can be seen till $98.15, which acts as a next resistance for the price, and if price breaks the $98.15 level and sustains over it, then the next resistance is at $126.4. Furthermore, if the price faced rejection from the $85.50 resistance and breaks the trendline, then the price can be seen at $68.75 support and to $62.70 support.
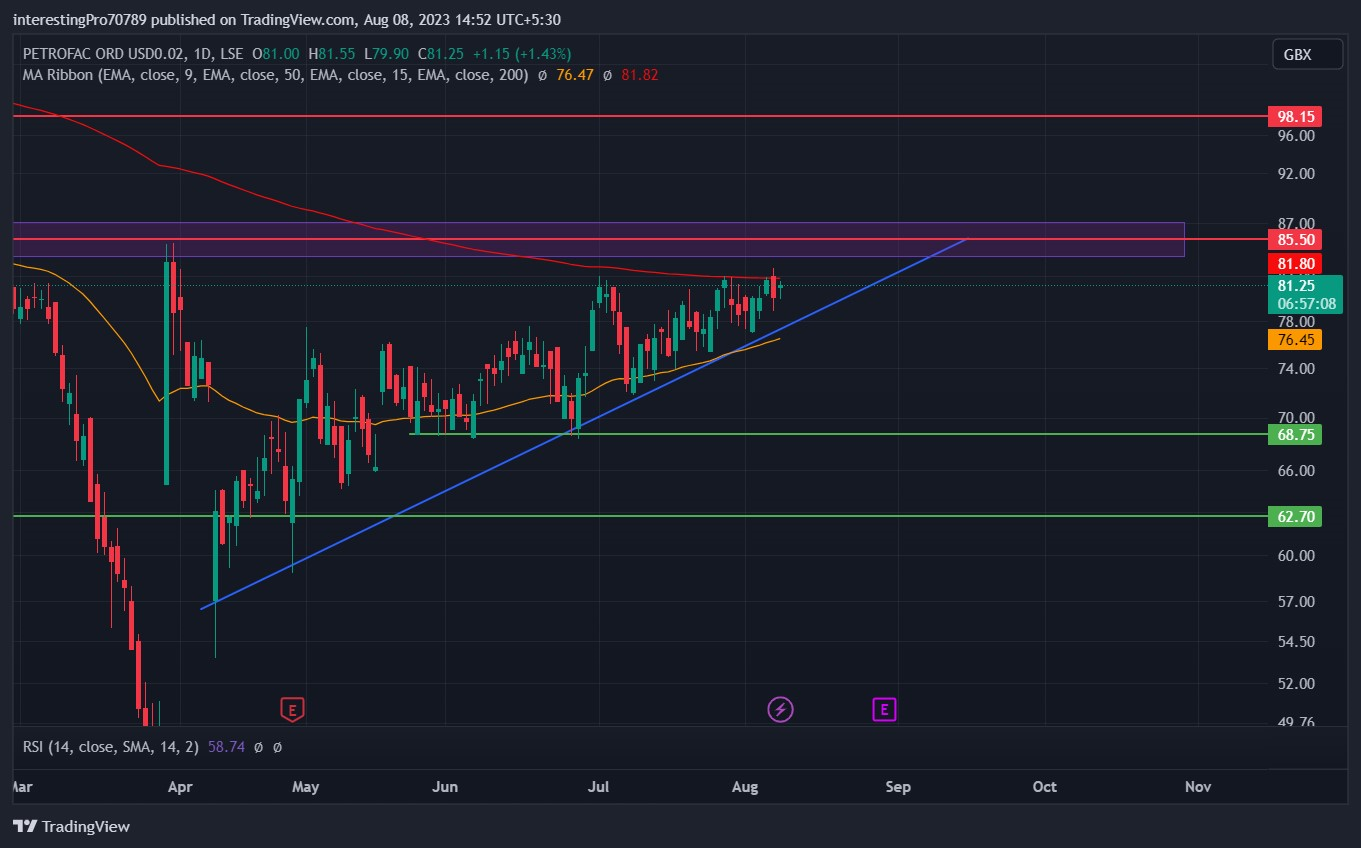
The 50 EMA (yellow line) is at $76.45 and the 200 EMA (red line) is at $81.80. Both EMAs are sideways and PETROFAC Stock price is currently trading in between them as of right now. If we see a crossover of the 50 and 200 EMA in this zone, then a good bullish momentum can be triggered from here. If the price closes below the 50 EMA, then the price has a higher chance of falling from that point.
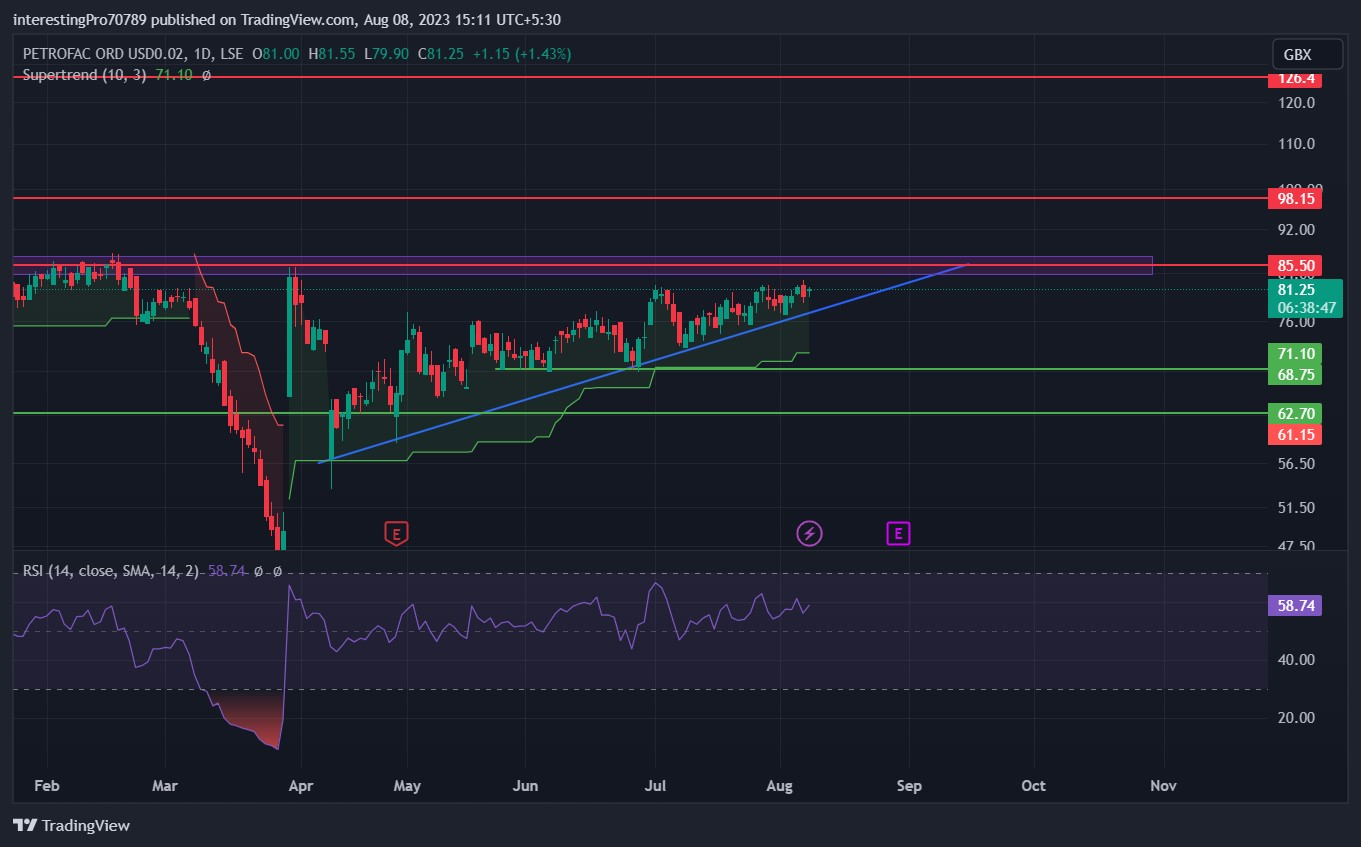
The relative strength index (RSI) is at 58.74. The RSI line is trending in an upward direction, which shows the bullish sentiment and buyer’s control in the Petrofac chart.
The SuperTrend indicates that the price is still in the bullish sentiment and buyers are in control as the price is still trading above the green line as of right now. If the price closes below the green line, then only the bearish momentum could be seen in the Petrofac chart.
Conclusion
The overall chart of Petrofac is in an uptrend and is very close to its resistance of $85.50 from where PETROFAC Stock price had faced rejection previously. If it manages to give a huge volume breakout and sustains over it, then the price can show a bullish rally to its next resistance. If the price faces rejection from the $85.50 resistance, then the price can again be seen at its previous support. All the indicators are bullish or neutral right now.
Technical levels
Resistance levels: $85.50, $98.15 and $126.4
Support levels: $62.70 and $68.75
Disclaimer
The views and opinions stated by the author, or any people named in this article, are for informational purposes only. They do not establish financial, investment, or other advice. Investing in or trading crypto assets comes with a risk of financial loss.


