

- Litecoin price (LTC) slid 1.10% in the last 24 hours and is currently trading at $82.16.
- Litecoin (LTC) whales data states that whales hold a total of 14.3% with a significant decrement of 3.1% over the past 1 year.
LitecoinToken (LTC) is a cryptocurrency that is similar to Bitcoin, but faster and cheaper. It is one of the most widely used cryptocurrencies in the world, with more than 2,000 merchants and stores accepting it. Litecoin transactions take only minutes and have very low fees. Litecoin is a simple and useful cryptocurrency that offers speed and cost-effectiveness.
The Litecoin price is currently trading at $82.16 with a decline of 0.04% in the past 24 hours. LTC holds a total market cap of $6.04 Billion and ranks 14th in the crypto market.


LTC token has a trading volume of $255.29 Million with an incline of 14.77% over the past 24 hours. It has over 73.5 Million tokens in circulating supply. The volume-to-market cap ratio of the LTC token is 4.2% indicating low volatility in the market.
Litecoin Price Prediction Using Price Action Strategy
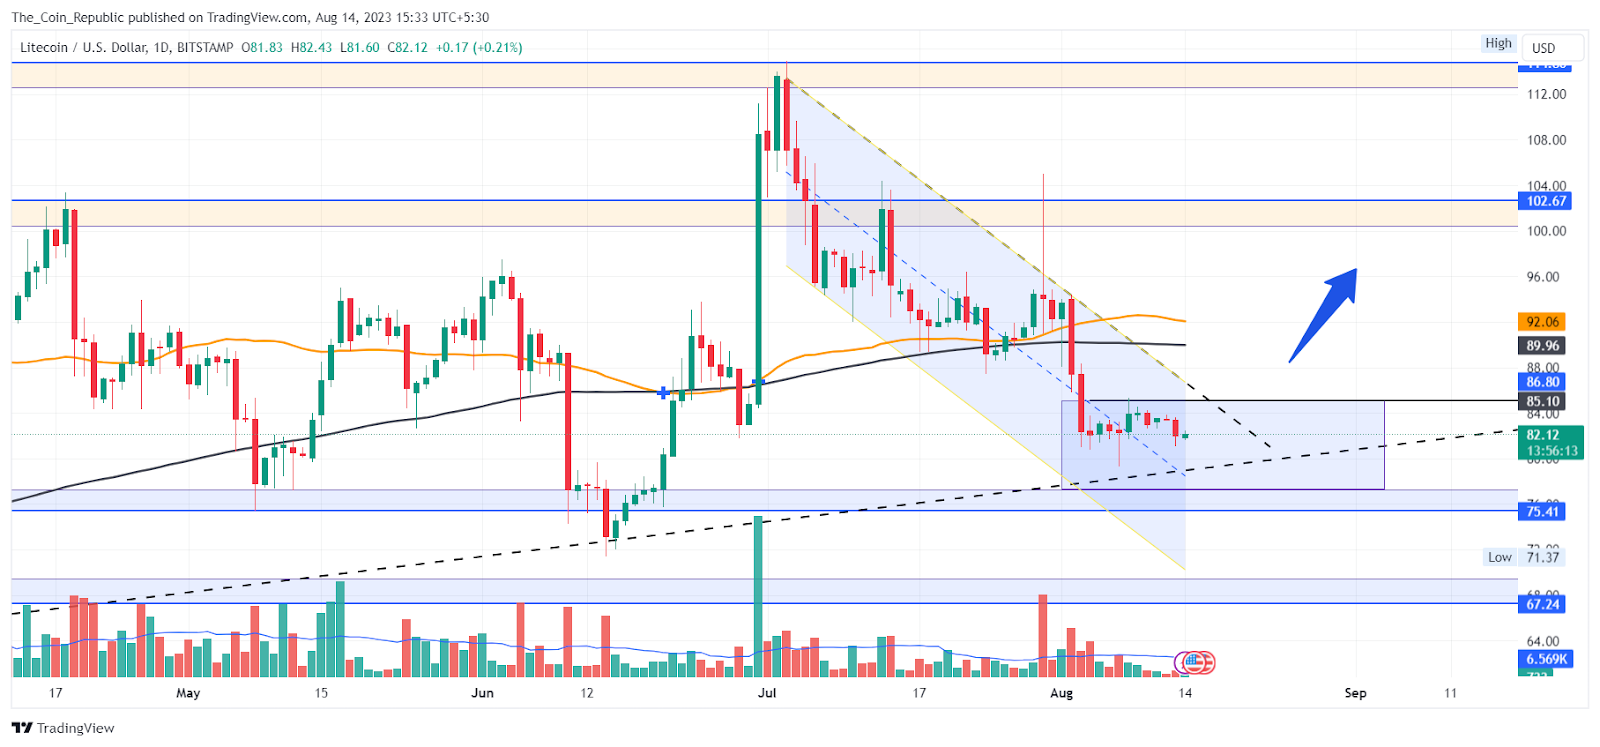
Litecoin price analysis reveals that the token price has been in an uptrend of 40% in June 2023, after taking a rebound from a trendline support. Thereafter, the price enter a correction phase and decline forming a parallel channel popularly known as a bullis flag.
Currently, the price is nearing the trendline support again from where buyers may take the charge and the price may observe a hike.
Now, the price may show a trending move if it is successful in breaking above the channel pattern. The short-term outlook of the price prediction indicates the price to consolidate near the trendline resistance followed by a breakout of the channel pattern. The price may then resume its long-term trend and surge higher.
LTC Price Forecast from Indicators’ point of view
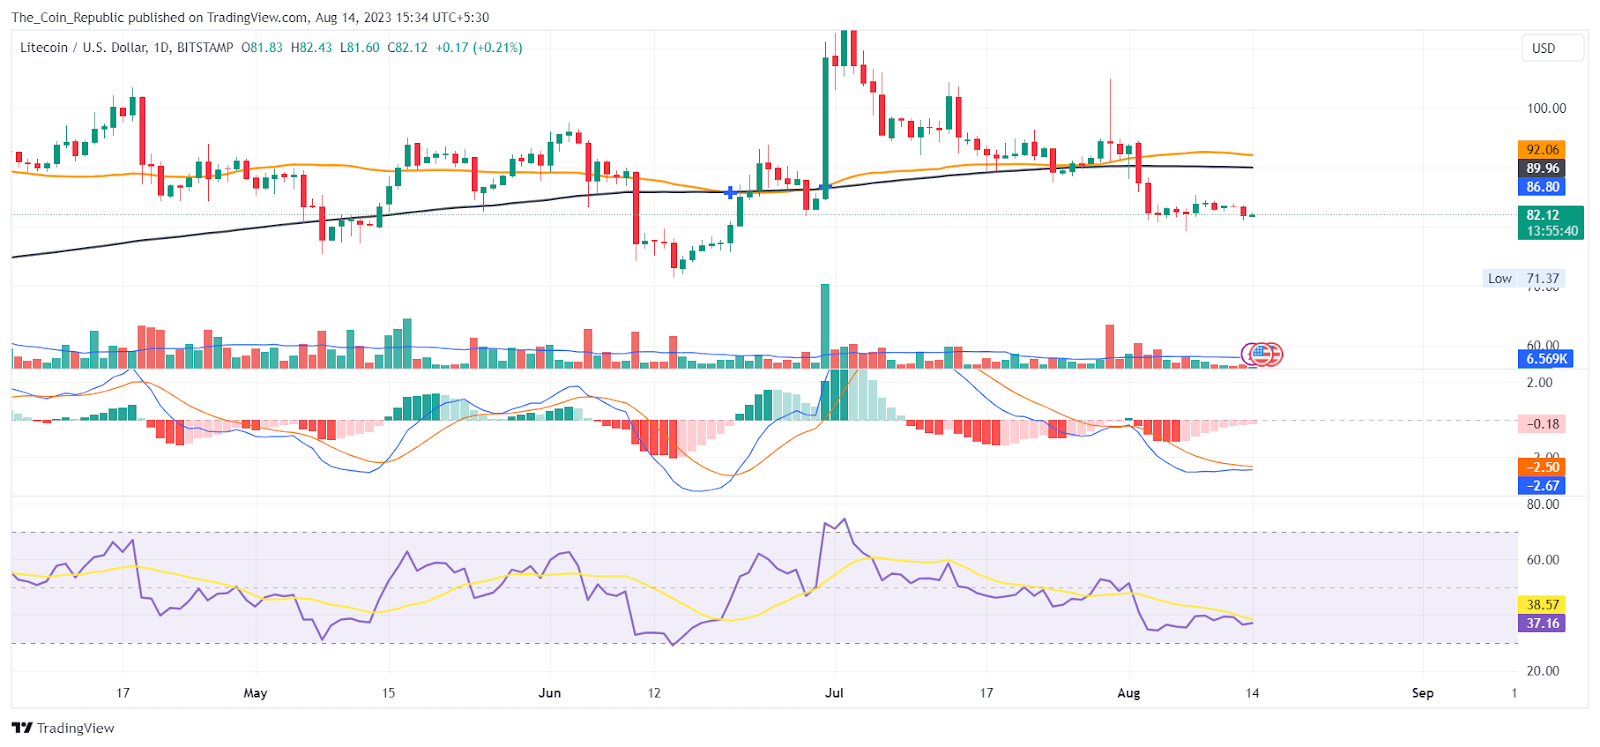
As per the EMA analysis, the LTC price could not sustain above the 50 and 200 EMA indicating the dominance of the sellers in the market prevailing.
At the time of publishing, the RSI value of the LTC is 36.87 and that of SMA line is 38.55. RSI is decline signals a bearish sentiment in the market at the current moment.
MACD lines have made a bearish crossover. However, histogram bars are being form below the mean line but of decreasing height indicating that the sellers are losing momentum and the price may possibly surge higher.
Conclusion
In conclusion, Litecoin price concludes that the price is in an uptrend since June 2023, but now correcting in a bullish pattern. The price may bounce from the trendline support and break above the channel. The short-term outlook is consolidation followed by a breakout. The long-term outlook is bullish. MACD shows decreasing bearish momentum.
Technical Levels
- Support levels: $75.41 and $67.24.
- Resistance levels: $102.67 and $114.80.
Disclaimer
The views and opinions stated by the author, or any people named in this article, are for informational purposes only and do not establish financial, investment, or other advice. Investing in or trading crypto or stock comes with a risk of financial loss.


