

- Chainlink price (LINK) is down by 4.82% in the past 24 hours and is currently trading at $6.97.
- Chainlink (LINK) price showed a bearish divergence in RSI after which the price declined nearly 17% in the last 30 days.
Chainlink’s price was in a range-bounded correction phase for the past 1 year. The price traded in a 40% range with a supply level between $8 to $10. The price has suffered multiple rejections and slid down to gain buying volume at the demand zone.
Recently, the price again rebounded from the lower demand zone and surged getting support from a lower trendline. However, the sellers got active near the supply zone and the price slid down to break the trendline support.
Analysts are having a negative view over the price chart. The price may again slid down to test the buyer’s presence near the demand zone if manages to breach below the 200 EMA.


Chainlink Token (LINK) is a network that enables smart contracts to use data from outside sources. It has many reliable partners that provide data for various purposes. Chainlink allows data providers to sell their data directly to the network and earn money from it.
Investors Worried As Chainlink Price Made Breakdown Of The Lower Trendline Support
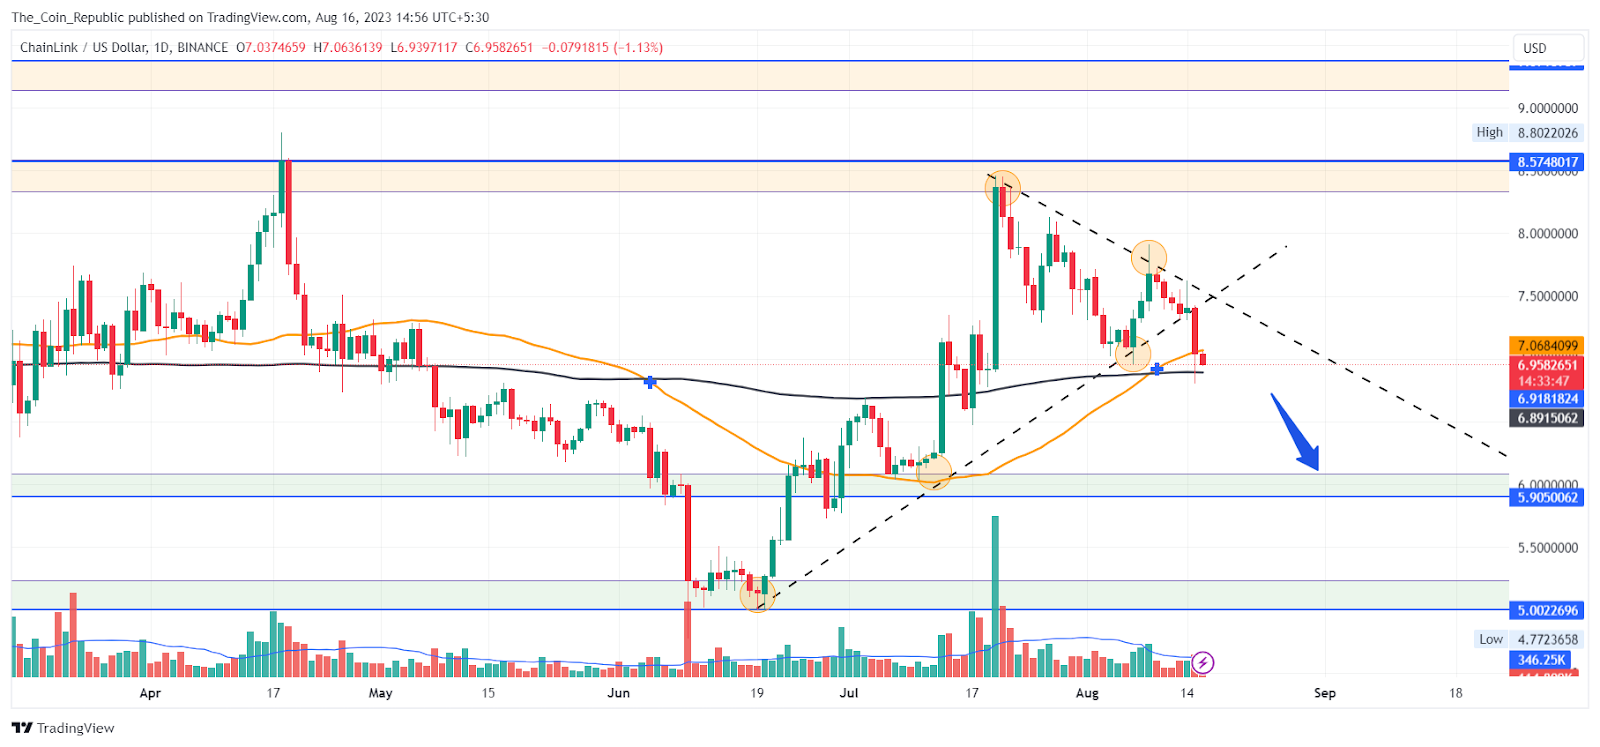
The short-term outlook for the LINK price stays on the bearish side as the price made a breakdown of the trendline resistance. This may invite more selling volume and the price may decline to the lower support zones.
The long-term outlook still stays on the neutral side as the price has been trading in a range of nearly 40% for the past 1 year. A directional move may be initiated after either the breakout or breakdown of the range.
Technical Indicators showing weakness in LINK Coin
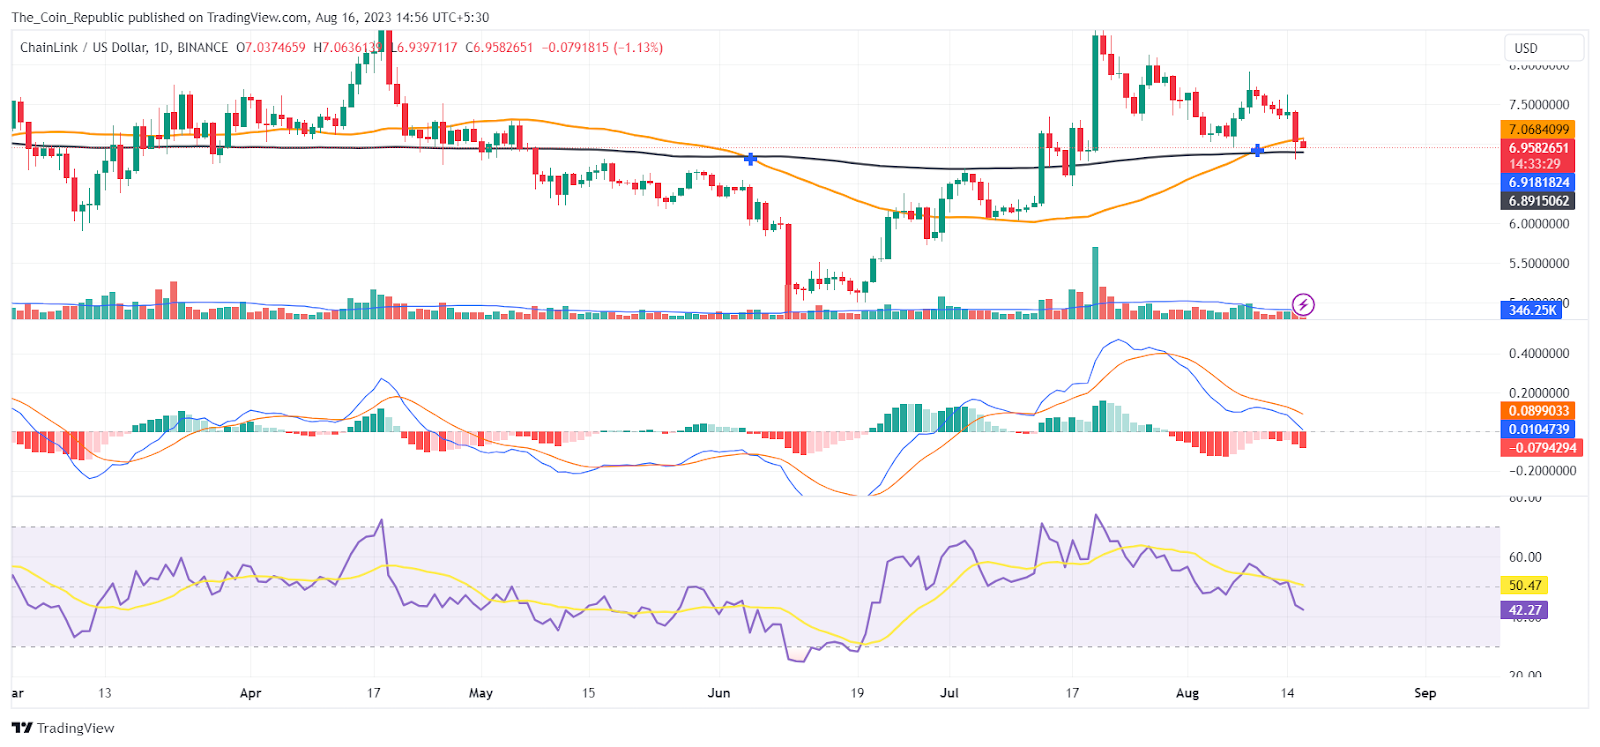
MACD lines have made a bearish crossover. Also, histogram bars are being formed below the mean line with increasing height showing a bearish sentiment dominating the market in the short term.
The EMA analysis shows that the LINK price failed to sustain above the 50 EMA indicating a weakness in the short term.
At the time of publishing, the RSI value of the LINK token is 42.48 and that of the SMA line is 50.49. RSI is declining suffering rejection from the SMA line indicating weakness in the market.
Conclusion
Chainlink price prediction concludes that the price has been consolidating in a 40% range per year. It bounced from the lower demand zone but failed to break the upper supply zone. Currently, the selling pressure led to the breakdown of the trendline support and may fall further. Analysts are bearish on the short-term outlook and neutral on the long-term outlook. The price needs a strong move to exit the range.
Technical Levels
- Support levels: $5.905 and $5.00.
- Resistance levels: $8.57 and $9.37.
Disclaimer
The views and opinions stated by the author, or any people named in this article, are for informational purposes only and do not establish financial, investment, or other advice. Investing in or trading crypto or stock comes with a risk of financial loss.


