

- FSR stock price surged 0.54% in the last trading session and is currently trading at $5.59.
- Fisker’s share price (NYSE: FSR) forms a symmetrical Triangle pattern on the daily chart.
FSR stock price was in a strong downtrend in the long term and declined nearly 45% in April 2023, after the breakdown of crucial support. Thereafter, the price entered a correction phase and formed a symmetrical triangle pattern.
Recently, the price suffered rejection from the upper trendline and slid to test the lower trendline of the symmetrical triangle pattern. The disclosure of results accelerated the momentum of decline and the price slid nearly 12% in the past week. Currently, the price is seeking buyers’ support near the lower trendline of the symmetrical triangle pattern.


Fisker, Inc. (NYSE: FSR) is a company that creates eco-friendly electric vehicles with innovative technology. It focuses on the whole automotive business model, from vehicle design and development to customer experience, sales, and service.
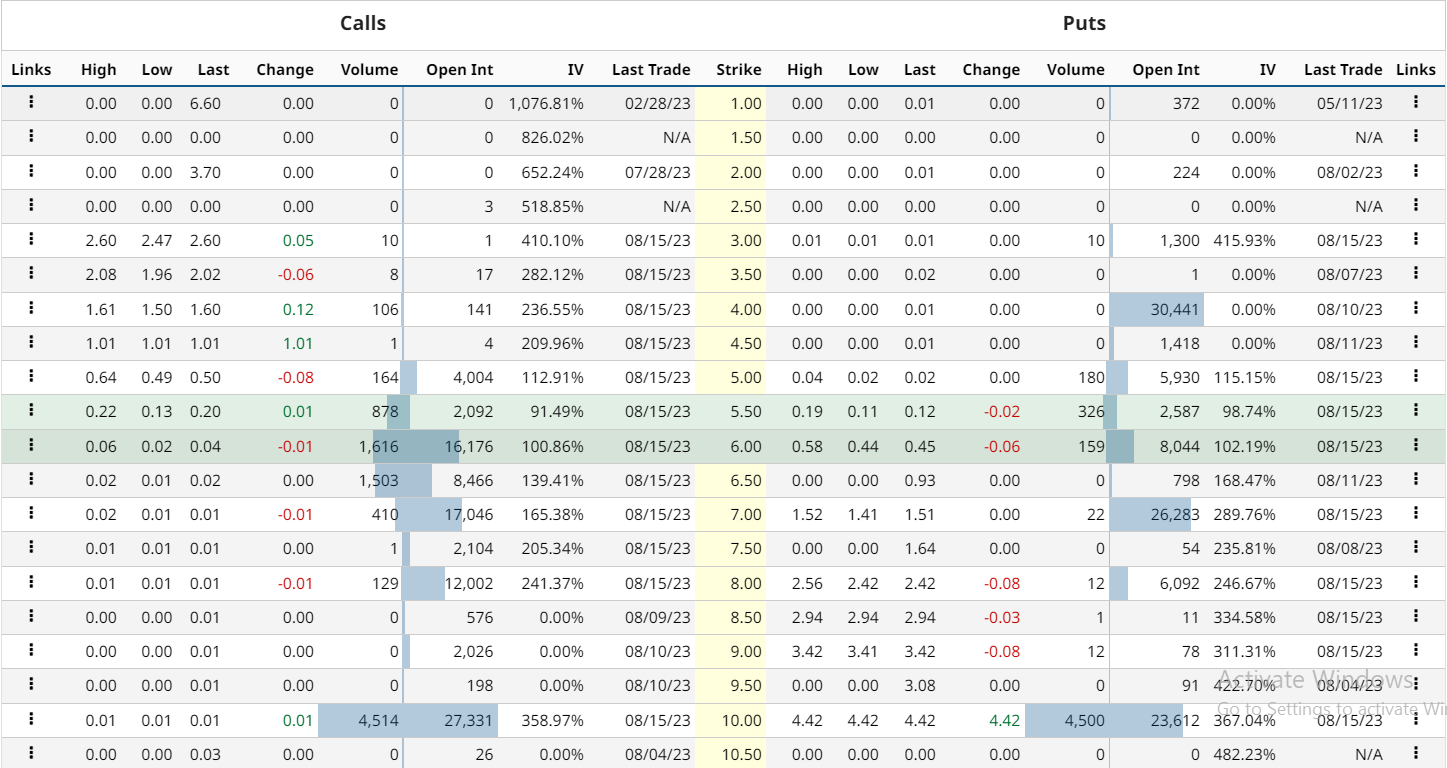
FSR stock option-chain analysis states that the current implied volatility in the market is 77% with an increment of 2.65% in the last trading session. The at-the-money strike price has 2587 open contracts on the put side and 2092 open contracts on the call side indicating the dominance of buyers at the current level. The PUT/CALL ratio is 1.03 indicating that PUT writers dominate the market as per the data.
FSR Stock Price Analysis In Daily Chart
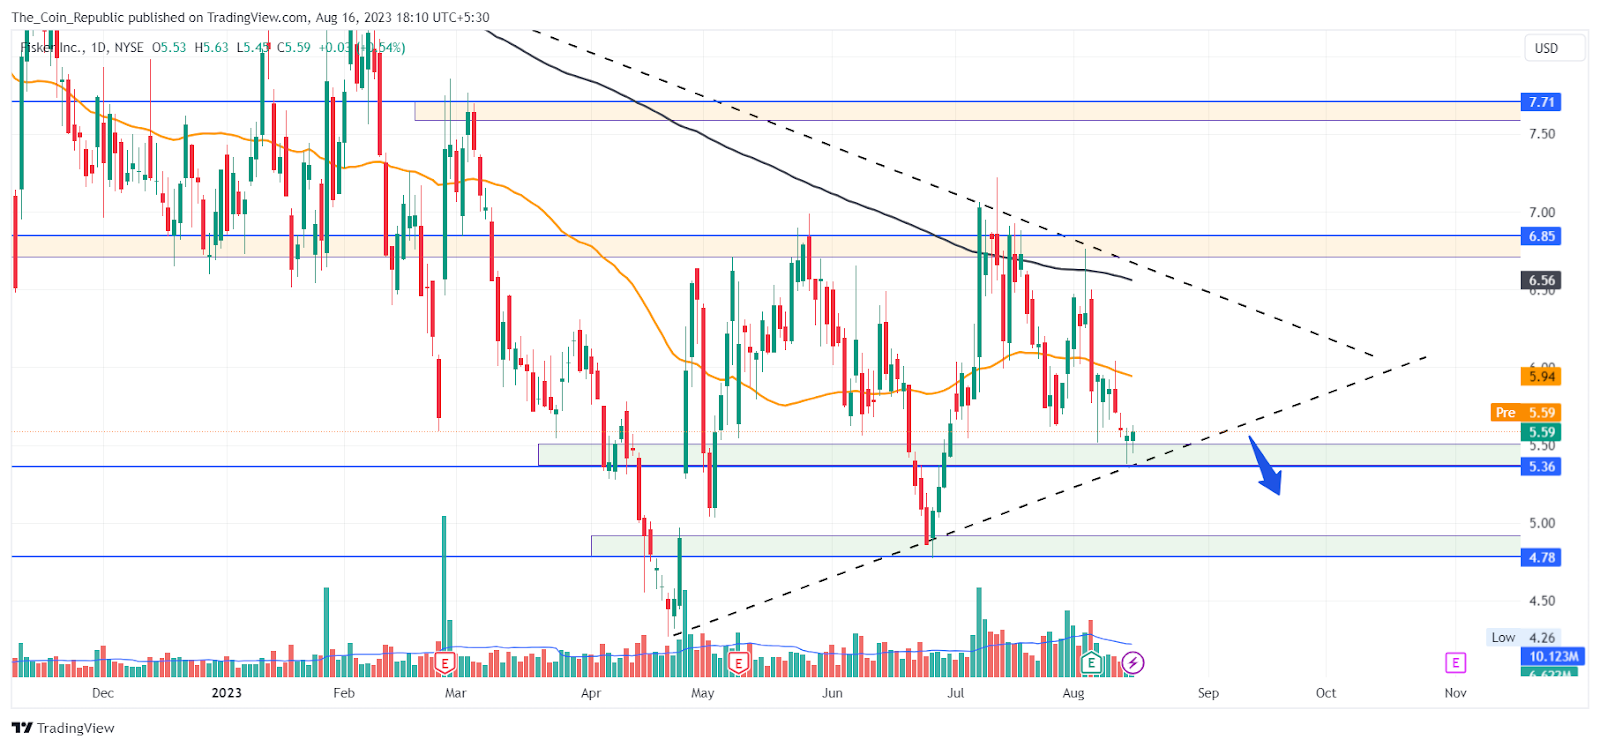
The short-term outlook for the stock price is indecisive until the price is trading in a symmetrical triangle pattern. The breakout or breakdown of the pattern may decide further directional movement in the stock.
The long-term outlook of the price trend is pessimistic as the price is declining in the long term and may resume its downward journey if breaks below the lower trendline of the channel pattern.
The Technical Indicators showing weakness in the Short Term
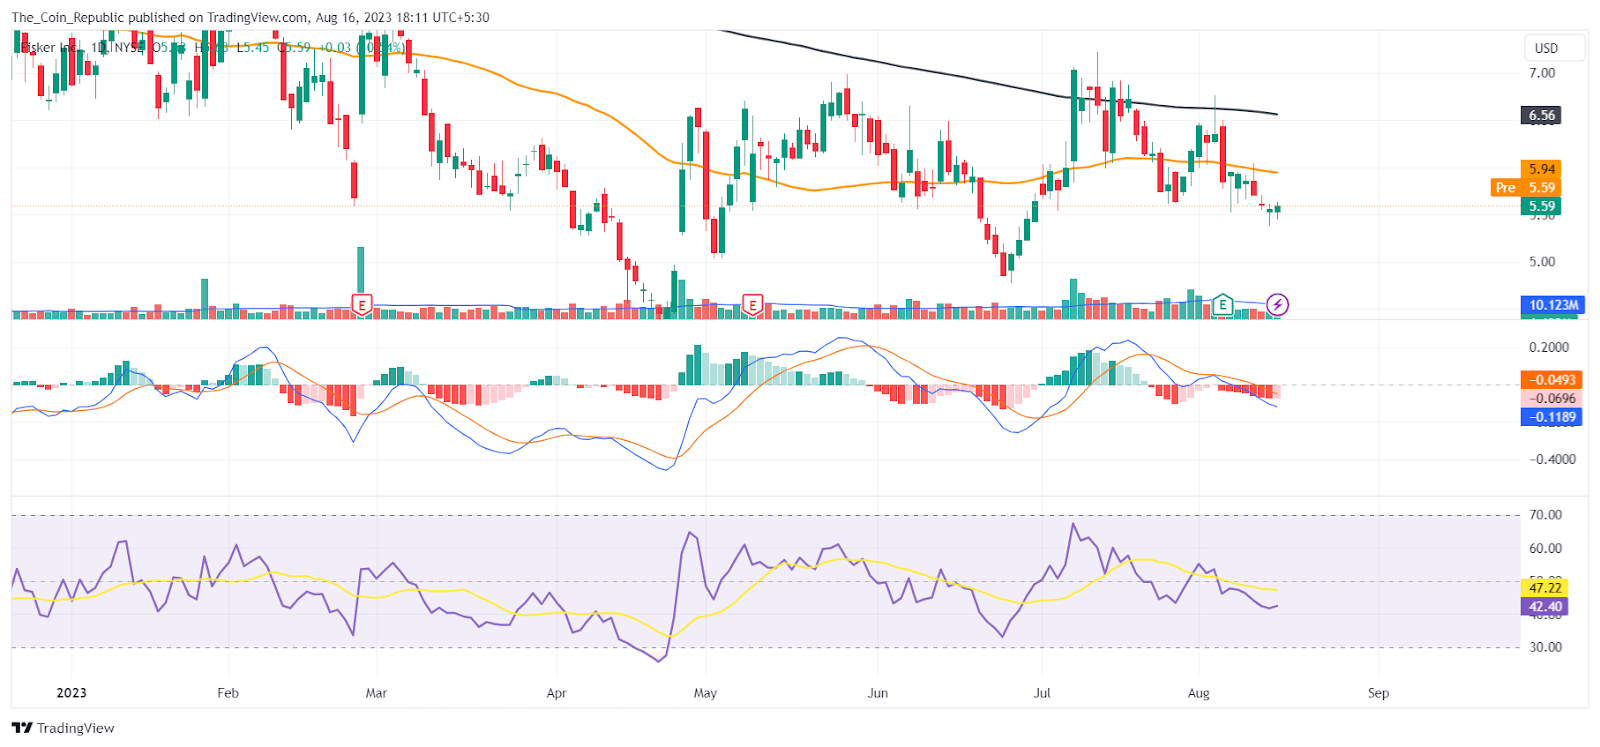
The daily FSR stock price chart shows that the price is trading below the 50 and 200 EMA indicating weakness in both the short-term and long-term in the market. The overall Technical Opinion rating including RSI and MACD is signaling a 64% sell with a weakening short-term outlook on maintaining the current direction.
Conclusion
FSR stock price prediction concludes that the price has been falling in the long term and is in a correction phase. It is forming a symmetrical triangle pattern and is near the lower trendline. The earnings report caused the price to drop by 12% in a week. The short-term outlook is uncertain until the pattern breaks. The long-term outlook is bearish as the price is below the EMAs. The technical indicators are mostly negative.
Technical Levels
- Support levels: $5.36 and $4.78.
- Resistance levels: $6.85 and $7.71.
Disclaimer
The views and opinions stated by the author, or any people named in this article, are for informational purposes only and do not establish financial, investment, or other advice. Investing in or trading crypto or stock comes with a risk of financial loss.


