

- Polkadot launches the OpenGov platform.
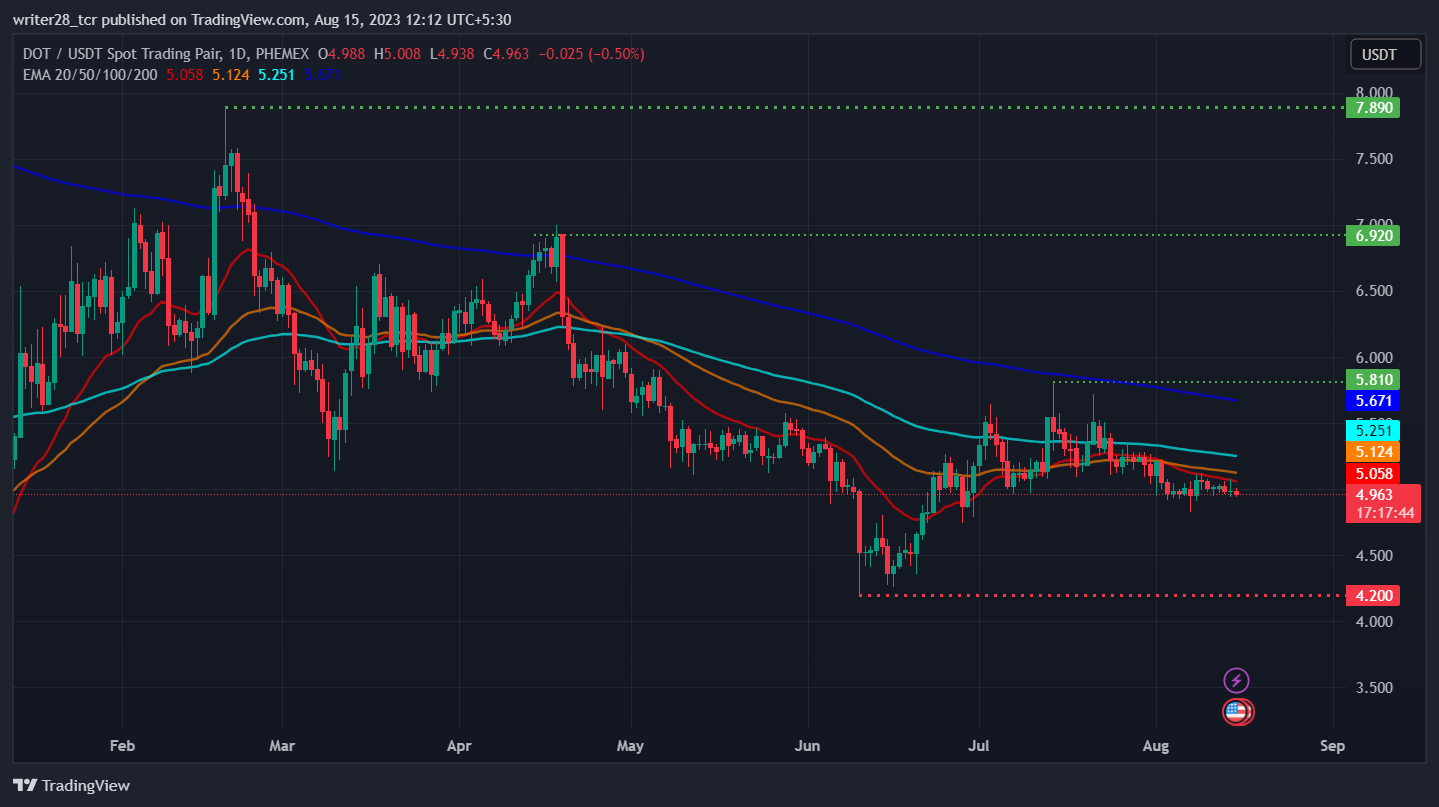
- The DOT price is currently trading at $4.97 with a return of -0.36% during the intraday session.
- The DOT price achieved an annual high on 19 February 2023, with a resistance level of $7.88.
Polkadot price reflects the bearish sentiment in the cryptocurrency market since 14 July 2023, with a monthly return of -8.60%. The price has moved by 0.22% in the past week, reflecting a positive outcome, and is currently at $4.96. However, in the previous 24 hours, DOT price has sunk by -0.36%.
The DOT price displayed an incline spike in June, which was affected when the world’s biggest asset manager, BlackRock, filed for an ETF (exchange-traded fund) that could act as a conduit in making bitcoin investment more mainstream.


Furthermore, the delays in that establishment assisted the entire cryptocurrency fall, which was also reflected in the DOT price.
Polkadot Launches the OpenGov Platform
The Web3 interoperability blockchain Polkadot has launched the OpenGov platform in the testing phase on Polkadot’s canary network, Kusama. This new development will detach the control of whales and will act fully autonomously.
This news was revealed when the DOT price was suffering at the annual low of $4.19; this new development catalyzed an increase in the price, enabling it to reach the resistance level of $5.81.
Recently, the DOT price revealed a subtle trend while witnessing a slight bearish momentum in the market. However, if the bulls get a stronghold on the DOT price, the price will retest the previous resistance level of $5.71.
On the contrary, if the current bearish sentiment continues, the DOT price might melt down toward $4.50.
Technical Analysis of Polkadot Coin

Polkadot’s chaikin money flow (CMF) score is struggling near the 0 mark and trades at 0.01, implying slight strength in the market. CMF has been trading above the 0 mark since 11 August 2023, indicating a slight involvement of bulls in the current market scenario.
The RSI (relative strength index) depleted after touching the 50 mark and currently trades at 41.13, suggesting increased participation of bears in the market. However, the DOT price is presently trading below the 20, 50, 100, and 200-day EMA, denoting weakness in the market.
The long/short ratio is 1.0568, with 51.38% longs and 48.62% shorts, suggesting a slightly higher position from the buyers’ side in the last 24 hours.
Conclusion
The market structure of the Polkadot price reflects bearish sentiments since 14 July 2023. Technical parameters suggest a rise in bearish pressure, but it now presents a cheap buying opportunity for investors as the price hovers near the annual low level.
Technical Levels
Major resistance: $7.88 and $6.99
Major support: $4.19 and $4.82
Disclaimer
The views and opinions stated by the author, or any people named in this article, are for informational purposes only and do not establish financial, investment, or other advice. Investing in or trading crypto assets & stocks comes with a risk of financial loss.


