

- MATIC price (MATIC) slid 6.06% in the last 24 hours and is currently trading at $0.5759.
- Polygon (MATIC) whales data states that whales hold a total of 68% with a significant decrement of 1.2% over the past 1 year.
Polygon (MATIC) is a project that aims to make blockchain transactions faster and cheaper by using a second-layer solution. This means that the project does not plan to change its basic blockchain layer anytime soon. The project simplifies the scalability problem and enables instant blockchain transactions.
The MATIC price is currently trading at $0.5759 with a decline of 6.06% in the past 24 hours. Polygon holds a total market cap of $5.36 Billion and ranks 12th in the crypto market.


The MATIC token has a trading volume of $440.1 Million with an incline of 31.21% over the past 24 hours. It has over 9.31 Billion tokens in circulating supply. The volume-to-market cap ratio of the Polygon token is 8.20% indicating mild volatility in the market.
MATIC Price Declines After Suffering Rejection From An Upper Trendline Resistance
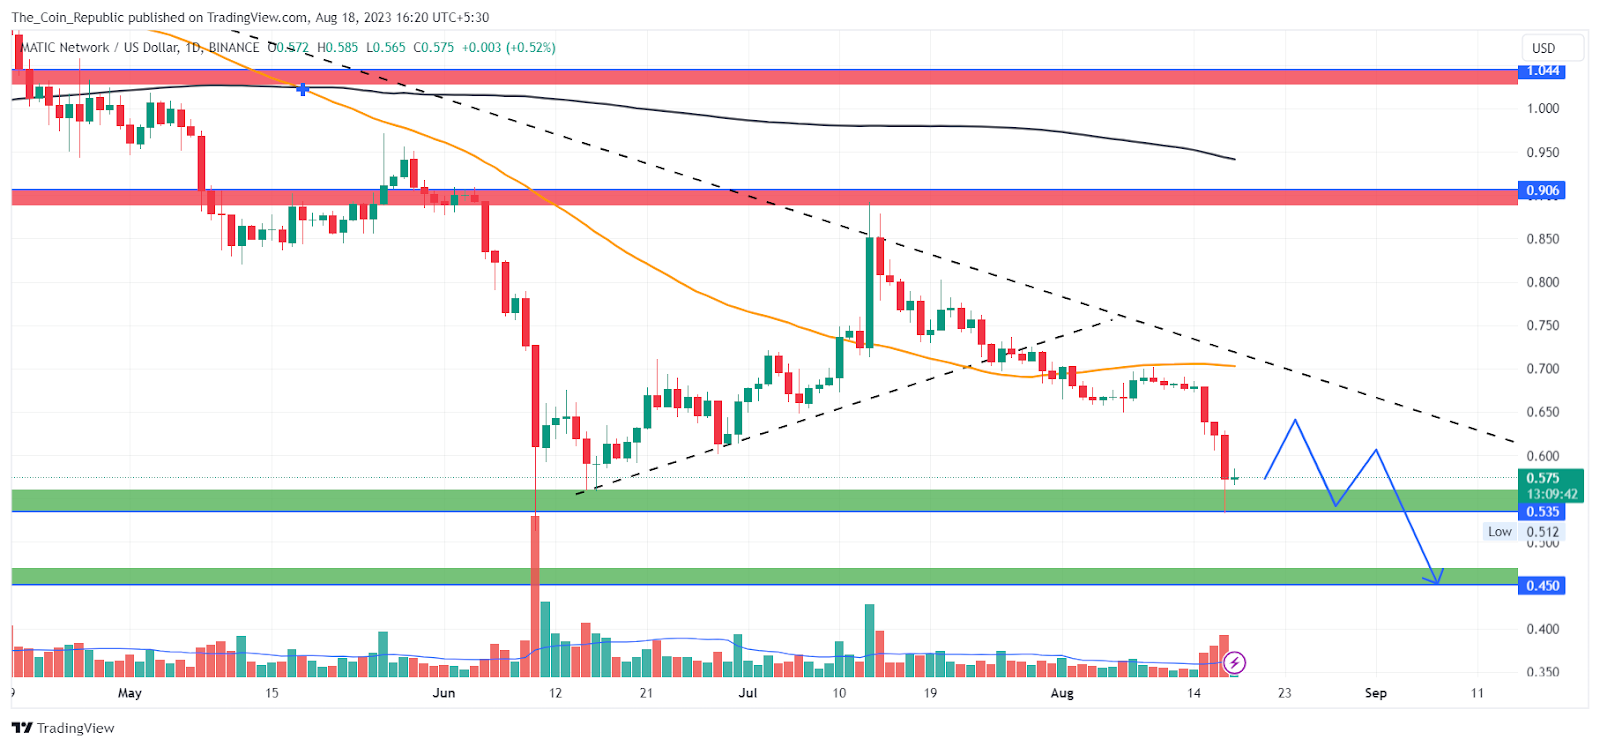
MATIC price prediction reveals that the price has been on a declining trend after hitting a high of $1.5 in February 2023. Since then, the price has declined by nearly 60% and formed lower highs. The price also seemed to respect a trendline resistance as the price faced multiple rejections from the trendline and declined.
Recently, the price took a rebound from the previous support zone and surged higher but suffered selling pressure near the trendline and slid again. Currently, the price is nearing the previous demand zone.
Now, analysts say that the price may show a trending move if it is successful in breaking above the trendline resistance. The short-term outlook of the price prediction indicates the price to consolidate if the precise get buyers’ support near the support. Else the short-term outlook stands on the bearish side. The long-term trend is already bearish.
Polygon Price Forecast from Indicators’ point of view

As per the EMA analysis, the Polygon price could not sustain above the 50 EMA indicating the dominance of the sellers in the market. The price is trading below 200 EMA which indicates the long-term bearishness in the market.
MACD lines have made a bearish crossover. However, histogram bars are being formed below the mean line but of increasing height indicating that the sellers are gaining momentum and the price may drop more.
Conclusion
MATIC price prediction concludes that the price has been falling in value since February 2023. It has been unable to break above a resistance line that has pushed it down several times. It recently bounced back from a support zone, but faced more selling pressure near the resistance line. The price is now approaching the support zone again. Analysts say that MATIC needs to break above the resistance line to start a positive trend, otherwise, it will continue to decline or consolidate. The long-term trend is already negative.
Technical Levels
- Support levels: $0.535 and $450.
- Resistance levels: $0.906 and $1.044.
Disclaimer
The views and opinions stated by the author, or any people named in this article, are for informational purposes only and do not establish financial, investment, or other advice. Investing in or trading crypto or stock comes with a risk of financial loss.


