

- The RKT stock price is currently trading at 5698 GBX.
- The company’s chart has been characterized by a sideways phase for an extended period of nearly two years.
The company Reckitt Benckiser (RKT) was founded in 1823 by Johann A. Benckise. The company engages in the manufacturing and trade of consumer brands of products like Air Wick, Dettol, Enfamil, Finish, and many more. The company operates through three segments: Hygiene, Health, and Nutrition.
Reckitt Benckiser Plc (RKT): Financial Analysis
The RKT financial report has shown growth in the last 3 years with some ups and downs in revenue from 2020 to 2022, with an overall growth of 0.03%. In 2021, the company’s reported revenue was down by 0.05% compared to the previous year. However, in 2022, the company managed to cover the previous year’s decline by an increase of 0.10% in revenue.


Reckitt Benckiser’s revenue report for 2023 is estimated to reflect a growth of 0.02%. The company’s revenue growth has demonstrated consistent and stable growth over the past three years, even surpassing the estimated revenue values. This trend indicates the company’s ability to meet its estimated revenue for the year 2023.
In 2020, the company achieved a dividend payout ratio of 104.57%, indicating that it distributed dividends to shareholders that exceeded its net income. However, in 2021, the company did not pay dividends, suggesting that it reinvested the funds back into the company for potential growth. Furthermore, in 2020, the company provided a dividend payout ratio of around 56.10%, which reflects a healthy distribution of profits to investors.
Reckitt Benckiser Plc (RKT): Technical Analysis

Currently, the RKT stock price is trading at 5698 GBX with an average volume of 1.123 Million and with a market capitalization of £41.548 Billion.
Around July, the RKT price found significant support within the buyer’s zone at 5512 GBX, sparking a notable bullish rally. The price surged to the level of 6700 GBX, where it encountered resistance and began to decline. Following the decline, the price revisited the 5512 GBX support level, from which buyers once again pushed the price upward, solidifying the strength of this support. The 6700 GBX level that previously acted as resistance now turned into a formidable resistance point.
Over the span of nearly two years, the price has exhibited a consolidating pattern within the range defined by these two levels. Presently, the price is situated close to the buyer’s zone at the 5512 GBX support. Should the price breach the buyer’s zone with a substantial decrease indicated by a large red candle. It could potentially lead to a further decline toward the next support level at 4960 GBX. Conversely, if the price manages to sustain itself above this zone, the buyers could drive the price upward, targeting the 6700 GBX resistance level.
In the event that price successfully breaks through the 6700 GBX resistance. It may experience a bullish surge towards the subsequent resistance level at 7774 GBX. However, if the price fails to overcome the 6700 GBX resistance, it could continue to consolidate within the range defined by these two zones.
Technical Indicators’ Prediction About the Current Trend.
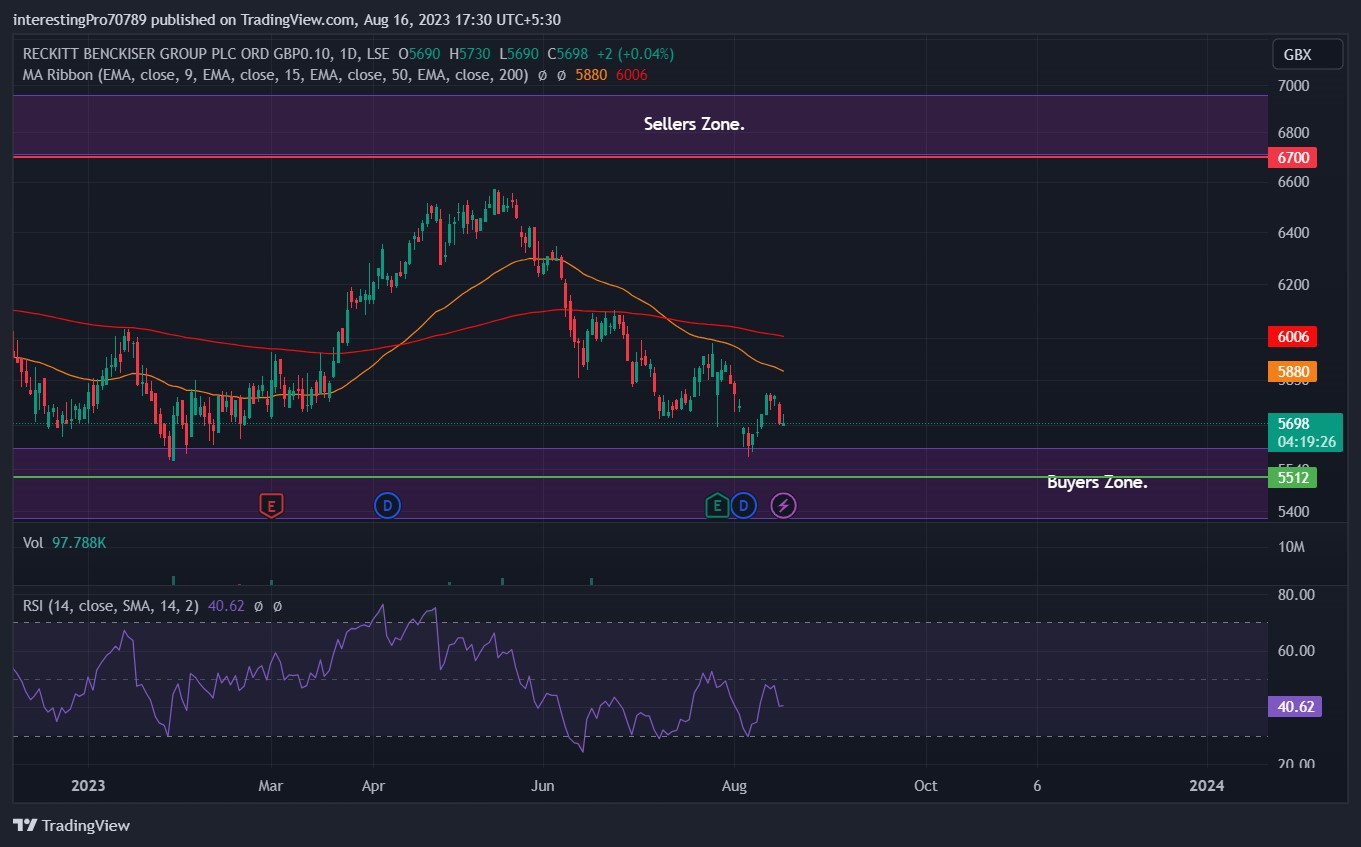
The 50 EMA (yellow line) is at 5880 GBX and the 200 EMA (red line) is at 6006 GBX. The recent price action has resulted in a significant technical event known as a “golden crossover,” where the 50-day EMA line crosses below the 200-day EMA line, indicating a shift from a bullish to a bearish sentiment. Currently, the price is trading beneath both the 50-day and 200-day EMA lines, further reinforcing the bearish stance.
The relative strength index (RSI) is currently at a value of 40.62, which places it in a neutral territory. This suggests that both buyers and sellers are exerting some influence on the price movement. However, it’s notable that the RSI line is trending in a direction that indicates a potential move toward bearish territory, implying increasing selling pressure.
Conclusion
The broader chart of Reckitt Benckiser (RKT) reflects a situation where the price movement two distinct zones, indicating a lack of clear direction as both buyers and sellers exert pressure on the price. This equilibrium between opposing forces has led to a state of indecision in the market.
The key to determining the future sentiment of the RKT chart lies in two potential scenarios: a breakout from the seller’s zone or a breakdown from the buyer’s zone. Such a decisive move would likely pave the way for a clearer trend to emerge.
Given the current state of uncertainty, traders are advise to exercise caution and patience. Waiting for a clear and decisive sign, such as a confirming candlestick pattern. When the price approaches either the buyers’ or sellers’ zone, can provide more confidence in taking long or short positions accordingly.
Technical levels
Resistance levels: 6700 GBX and 7774 GBX
Support levels: 5512 GBX and 4960 GBX
Disclaimer
The views and opinions stated by the author, or any people named in this article, are for informational purposes only. They do not establish financial, investment, or other advice. Investing in or trading crypto assets comes with a risk of financial loss.


