

- FTM price (FTM) surged 4.39% in the last 24 hours and is currently trading at $0.2045.
- Fantom price (FTM) declined nearly 40% in the last 1 month indicating a strong downtrend prevailing in the market.
FTM price facing a long-term declining trend losing 61% of its value in the past 6 months and declining nearly 45% in the past 3 months. The FTM price also seemed to respect an upper trendline as it suffered multiple rejections from the trendline and hit a new swing low.
Recently, the price declined after falling selling pressure from the trendline and declined till the previous support, consolidated but failed to get enough buying volume from the lower levels and made a breakdown.


Fantom (FTM) is a decentralized platform for DApps and digital assets that aims to solve the problems of Ethereum. It focuses on three aspects: scalability, security, and decentralization. Fantom provides tools for easy DApp integration, staking rewards, and DeFi features.
The FTM price is currently trading at $0.204 with a rise of 4.39% in the past 24 hours. Fantom holds a total market cap of $573.7 Million and ranks 61st in the crypto market.
The FTM token has a trading volume of $47.17 Million with a decline of 49.60% over the past 24 hours. It has over 3.17 Trillion tokens in circulating supply. The volume-to-market cap ratio of the Fantom token is 8.24% indicating a mild to high volatility in the market.
FTM Price Prediction Using Price Action Strategy
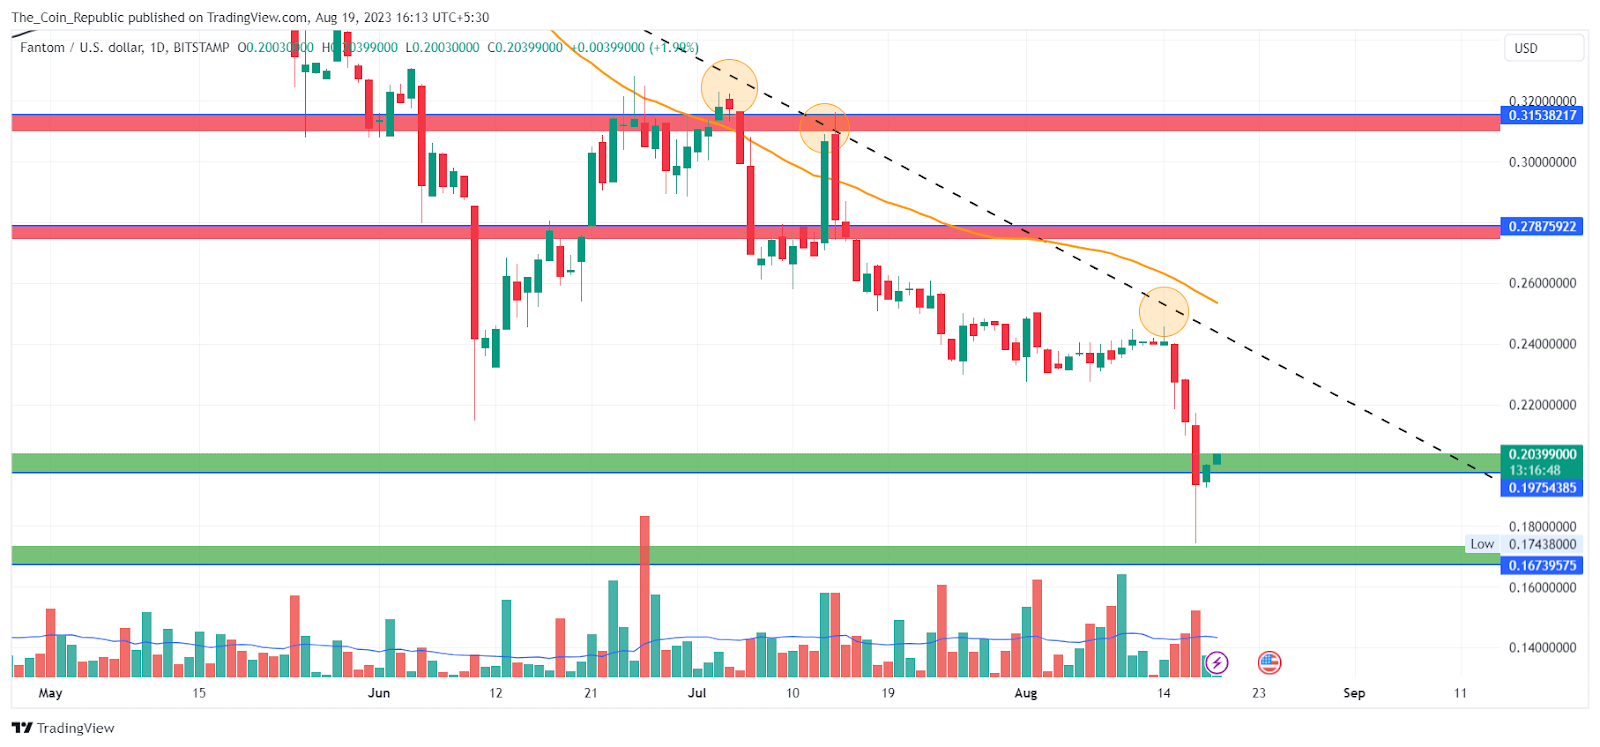
The price has turned bearish in the short term after breaking down from the support level. The analyst advises traders to apply sell on rise strategy for trading as the outlook is negative until the price breaks above the trendline resistance.
The price trend is also strongly bearish in the long term, as the price is making lower highs on the daily charts and failing to break above the previous peak. The price may continue to decline and form a new low.
Technical Indicators signal the continuation of the Ongoing Trend.
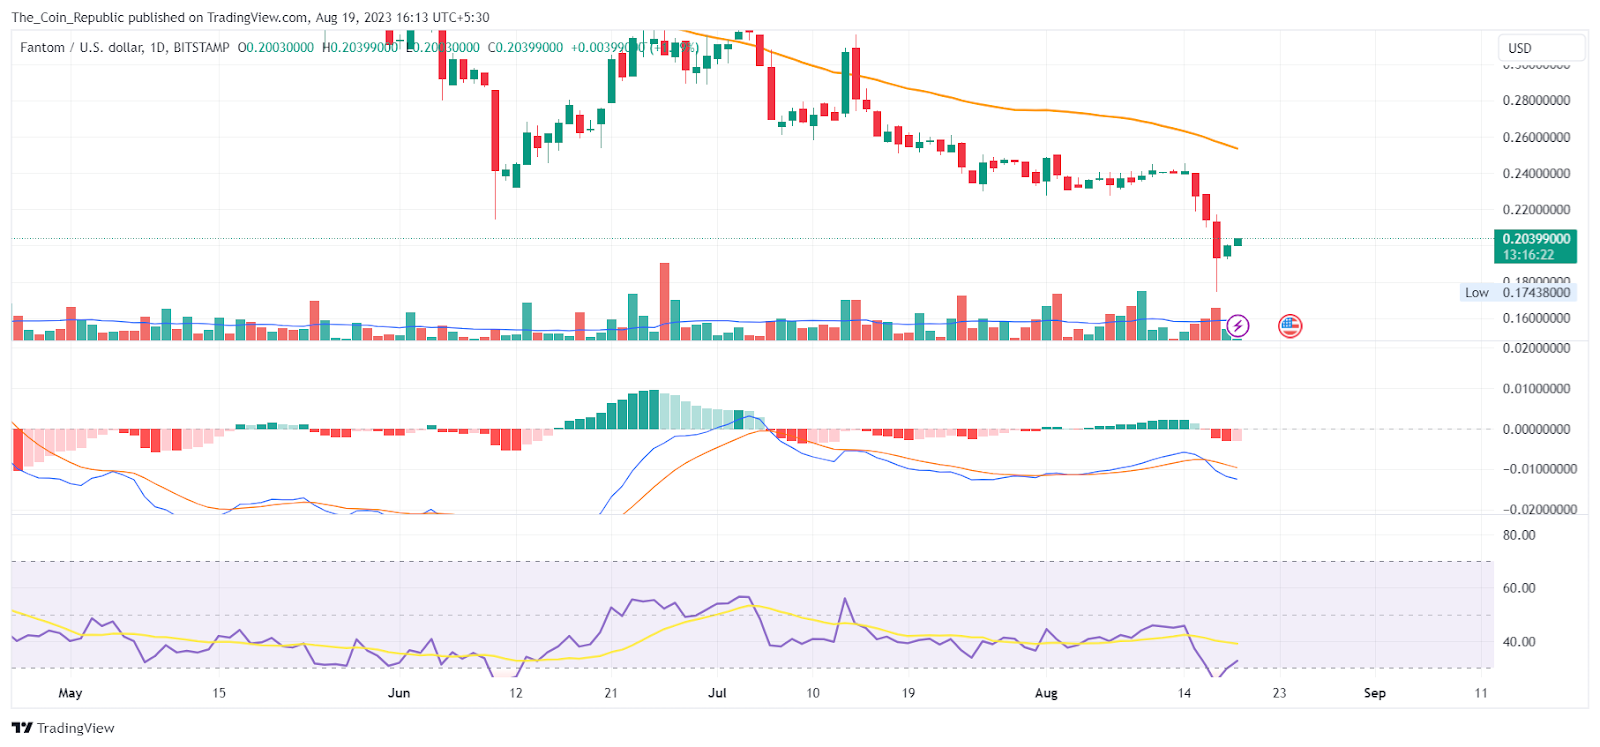
At the time of publishing, the RSI value of the Fantom token is 25.38 and that of the SMA line is 38.77. RSI has entered an oversold region indicating the aggressive selling pressure in the market.
As per the EMA analysis, the Fantom price is trading below 200 EMA which indicates the dominating bearish trend. Also, the price suffered rejection from the 50 EMA and slid down indicating the short-term presence of sellers in the market.
MACD lines have made a bearish crossover. Also, Histogram bars are being formed below the mean line and of decreasing height indicating weakness in the market. Which may continue to prevail as of now.
Conclusion
FTM price prediction concludes that the price has been declining sharply for six months and faced rejections from the upper trendline. It broke below the previous support and turned bearish in the short term. The analyst suggests selling on the rise until the price breaks above the trendline. The long-term trend is also bearish as the price makes lower highs and fails to break above the previous swing high. The price may decline further and make a new swing low.
Technical Levels
- Support levels: $0.1975 and $0.1673.
- Resistance levels: $0.2787 and $0.3158.
Disclaimer
The views and opinions stated by the author, or any people named in this article, are for informational purposes only and do not establish financial, investment, or other advice. Investing in or trading crypto or stock comes with a risk of financial loss.


