

- Entain stock price prediction: The market reacts to its poor half-yearly report
- The stock prices fell hard to the level of its support zone. See if it is the time to buy.
- RSI has given a possible bullish signal. See the possible prediction down below.
ENT plc posted a positive Annual earnings report in March 2023. It was followed by another good news for the investors as the Company announced £8.5 per share dividends. It created a bullish rally in the ENT stock price.
The stock started rising after bouncing off its support level of £1,164 at the end of March this year. This bullish rally continued till the stock price made a new high of £1,516 in early May this year.


Technical analysis and price prediction of ENT stock
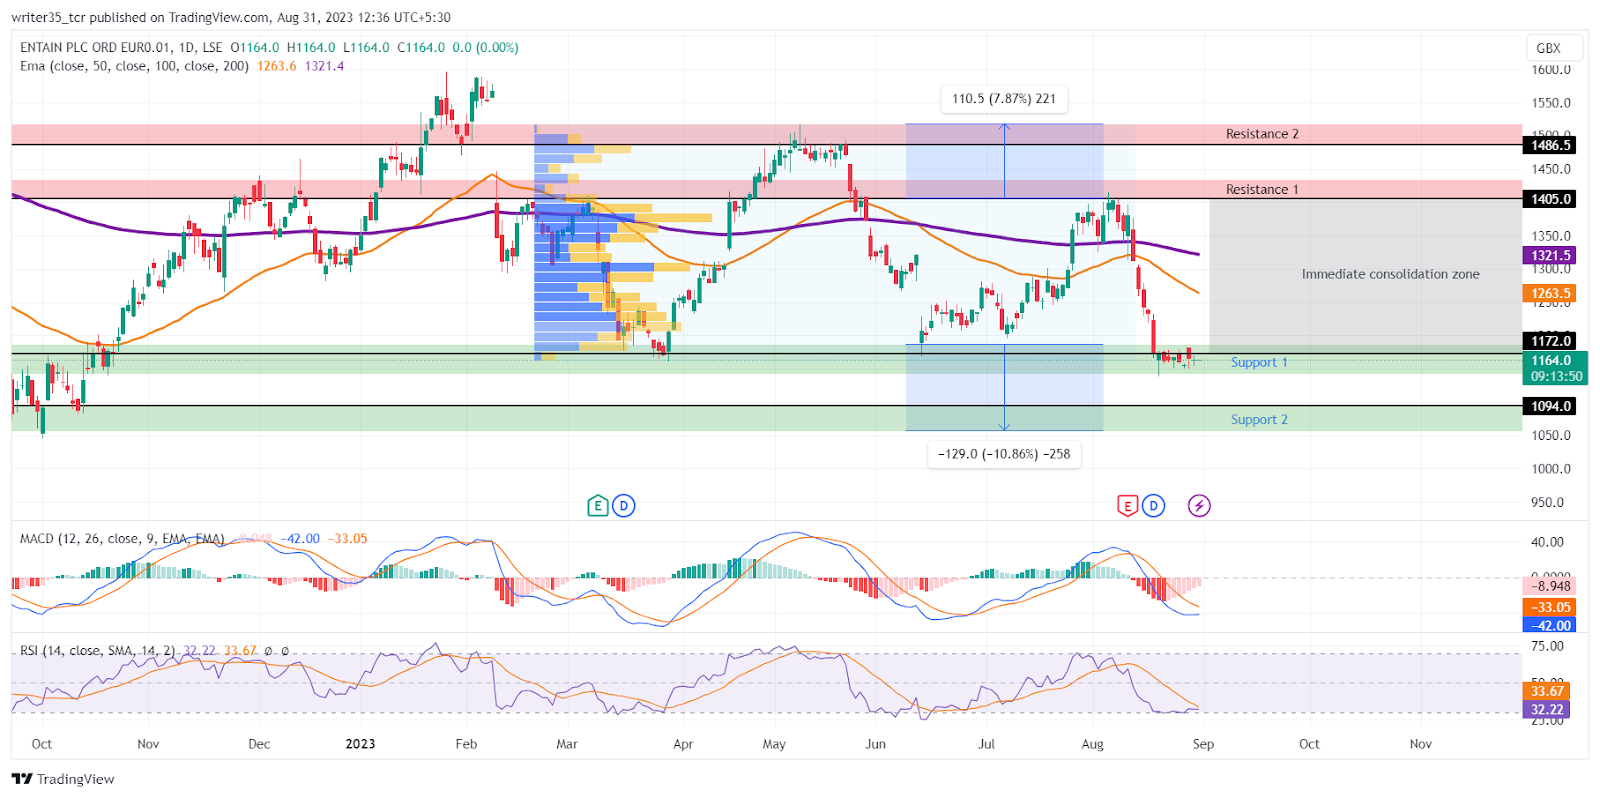
At the time of writing this post, the stock shown some bearish momentum after crossing both of its EMAs. The ENT stock price is currently trading at £1164. However, this level is the support zone of stock with its line made of £1,172.
The second support level is made about 10.86% down from the current level, at £1,094. This support level was also made in September of 2022. It shows that the bears are currently active.
Now, the first and immediate resistance is visible at the level where the stock price took a hit from the bears. The second support is being made 7.8% up on the £1,486 level.
What are the indicators showing?
Between these supports and resistances, some of the main indicators like the Moving average convergence/divergence (MACD), Relative strength index (RSI), and Exponential moving averages (EMAs) are giving some insightful data related to the possible price action in the future.
The MACD is showing a bearish momentum after the MACD line and its EMA did a bearish crossover at the start of this August. Both lines came below the neutral zone of zero. The MACD is at -42.05 while its EMA is above it at -33.05.
The RSI on the other hand is showing a downtrend because the stock has fallen. The RSI is flowing near its oversold zone of 30 because the bulls are fighting hard to show their strength in prices. The Simple moving average line (SMA) of the RSI line made a bearish crossover with it in early August. They are meeting at the level of 33, which may result in a bullish trend.
Let’s assess indications from EMAs. The 50 EMA made a bearish crossover with 200 EMA on the 12 June. The 50 EMA is at the level of £1,263 whereas the 200 EMA is up at £1,321. Both are above the current market price.
Are ENT stocks worth buying?
The ENT stock is looking slightly bullish if the bulls can push above the current support level. The RSI has also confirmed that the bulls are strong in the current demand zone. The RSI and its SMA are expected to make a bullish crossover.
if the price falls past its immediate support, it may contain the second support of £1,094.
Technical Levels
Support:£1171, £1094
Resistance: £1405, £1486
Disclaimer
The views and opinions stated by the author, or any people named in this article, are for informational purposes only. They do not establish financial, investment, or other advice. Investing in or trading crypto assets comes with a risk of financial loss.


