

- CVX Coin price prediction: A strong bearish trend is seen in the coin
- The bears have taken control as they are breaking major support levels
- The RSI shows weakness in bullish investors as it hovers near its oversold levels
The CVX coin started the year on a positive note, as it bounced off its support level of $3.24 and started rising. By the time February came, the price of the CVX coin had risen to a level of $7.25. It showed over 123% growth in just a month!
The bullish trend did not last for a long time as the CVX coin price soon started to fall. It initiated a bearish trend. The bears broke a major support level of $4.97 by the time May came. It resulted in a fearsome moment for the bullish investors and later resulted in the breaking of another support level of $3.88 in July.


CVX Coin Price Technical Analysis and Prediction
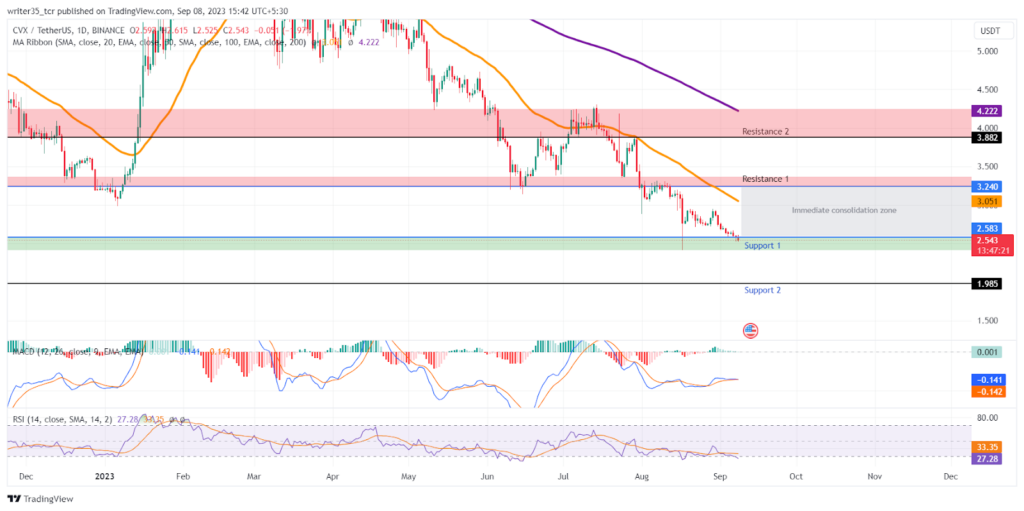
As of this writing, the CVX coin price has broken another support level of $3.24. It is currently trading at a level of $2.58, which is near its all-time low. This same level is also its immediate support for the moment. The continuous downfall in the coin is a clear indication of a strong bearish trend. Unless there is a significant trend reversal in the market sentiment, it is likely to continue.
However, the CVX coin price is trading near its all-time low level. If it breaks its immediate support level, a second support is at $1.98. On the other hand, the resistance levels are up at $3.24 for the immediate once and $3.88 for a second resistance level
What are the indicators showing?
Past the supports and resistances, indicators like MACD have been showing a sideways moment since the start of this August. There has been a tussle going on between the MACD and its EMA line. However, both the lines are below the neutral zone of zero. The MACD is at -0.13 while its EMA is at -0.14
Furthermore, the RSI is stuck on the oversold level of 30 since the CVX coin broke its resistance of $3.88 in July. It indicates a fall in the strength of bulls over time as the downturn has been there for a long time. Another concern for the bulls is the Simple moving average (SMA) of the RSI. It has made a bearish crossover with the RSI line back at the start of this September.
The EMAs on the other hand are above the price action since the 50 EMA last rejected CVX coin price in May 2023. The 50 EMA is currently at the level of $3.052 and the 200 EMA is at the 2nd resistance zone of $4.22
Conclusion
The price prediction for the CVX coin will be bearish as the downtrend continues. The RSI is also showing weakness in the strength of bulls. If the price drops at the level of current support, a new all-time low may occur at the level of $1.98.
Technical Levels
Support:$2.58, $1.98
Resistance: $3.24, $3.88
Disclaimer
The views and opinions stated by the author, or any people named in this article, are for informational purposes only. They do not establish financial, investment, or other advice. Investing in or trading crypto assets comes with a risk of financial loss


