

- The coin is seen breaking its immediate resistance level after bouncing off from its year-to-date low.
- The coin’s price is moving towards its first resistance as it passes its 50 EMA level.
- The MACD and RSI are wildly bullish after the price surge.
Back in December of last year, the IOTA coin experienced a significant increase in price after it bounced back from its major support level of $0.1595. As the weeks went by, bullish investors continued to push the price past all possible resistance levels along the way.
At the time of writing, the price of IOTA has bounced off after hitting a year-to-date low for 2023. The bulls seem to be in control, having successfully broken through the resistance level of $0.1515, which is now acting as immediate support for IOTA. However, it may be too early to assume that the price will remain above this level a sky-high level of $0.2747.


Technical Analysis and Price Prediction
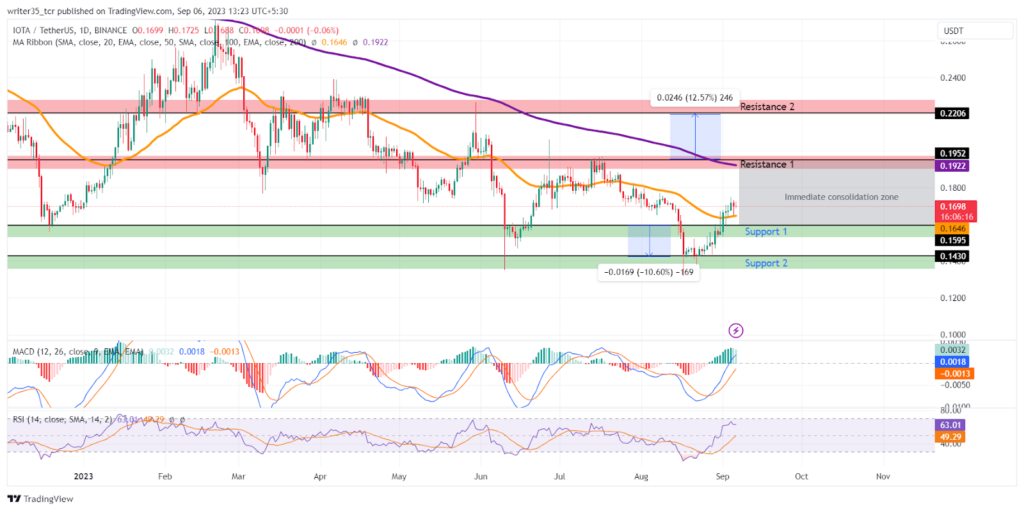
After the happy and bullish days of the IOTA community, the bears made a re-entry into the charts. This quickly pushed the price levels down to a level of $0.1952 after breaking its previous support of $0.2206. However, the bulls tried to fight back till the supply zone of $0.2275, but could not sustain that level.
Since then, the coin hasn’t been able to recover and has been in a continuous downtrend, breaking three major support levels along the way. Recently, the bears made the price hit the year-to-date low of $0.1318 in mid-August this year. Now looking above at the resistance levels, the immediate resistance is at the level of $0.1922. This is the point where the coin’s price is likely aiming to go for. Meanwhile, the second resistance level is 12.5% above at $0.2206.
What are the indicators showing?
Now coming to the Indicators, the first and foremost indicator we will analyze will be the MACD. As of now, the MACD line is at a level of 0.0018. It made a bullish crossover with its exponential moving average (EMA) line back in late August. Currently, the MACD line is above the neutral zone of zero, while the SMA line is below it.
The relative strength index (RSI) is showing something similar to the MACD. The RSI line spiked after touching its oversold levels of 22 back in August. Currently, it is at the overbought zone of 64, while its Simple Moving Average (SMA) line is down below at 49.
Furthermore, the 50 EMA is currently positioned below the current price, indicating that the bulls have recently managed to surpass it. At the level of $0.1646, the 50 EMA could serve as a critical support point for the bulls, provided they can maintain the IOTA coin price above it. Meanwhile, the 200 EMA is situated above at $0.1922, indicating a potential resistance level.
Price Prediction for IOTA Coin
The price prediction for the IOTA coin will be bullish if investors can sustain the price above its 50 EMA. If that happens, then the price is likely to move towards its immediate resistance level of $0.1952. Otherwise, the coin is likely to go towards its support zone of $0.1595
Technical Levels
Support:$0.1595, $0.1430
Resistance: $0.1952, $0.2206
Disclaimer
The views and opinions stated by the author, or any people named in this article, are for informational purposes only. They do not establish financial, investment, or other advice. Investing in or trading crypto assets comes with a risk of financial loss.


