

- The price is currently at its last support level, which is near its all-time low. Take a look at the prediction.
- The bears frequently push down the price, despite a strong demand zone. See whether the bullish investors will return.
- The 200 EMA rejected the bulls in the middle of August and it is currently at the resistance level.
The KNC coin was first launched in February of 2018. In December of 2022, the KNC coin price experienced a significant drop, going down to $0.45.This created fear in the market as it was near its all-time low levels. However, the new year brought about a bullish change in fortune for the KNC coin investors.
In mid-January of 2023, the KNC coin broke past a major resistance level of $0.662, which was a significant milestone for the Kyber team. This was followed by the bulls breaking KNC’s 50-day Exponential Moving Average (EMA) and then another major resistance of $0.712


As a result of these bullish rallies, the KNC coin continued to rise in value, reaching a 52-week high level of $0.970 in February this year. However, since then, the KNC coin price has seen a bearish trend in the market, which pushed the price down to current levels.
KNC Coin Price Technical Analysis and Prediction
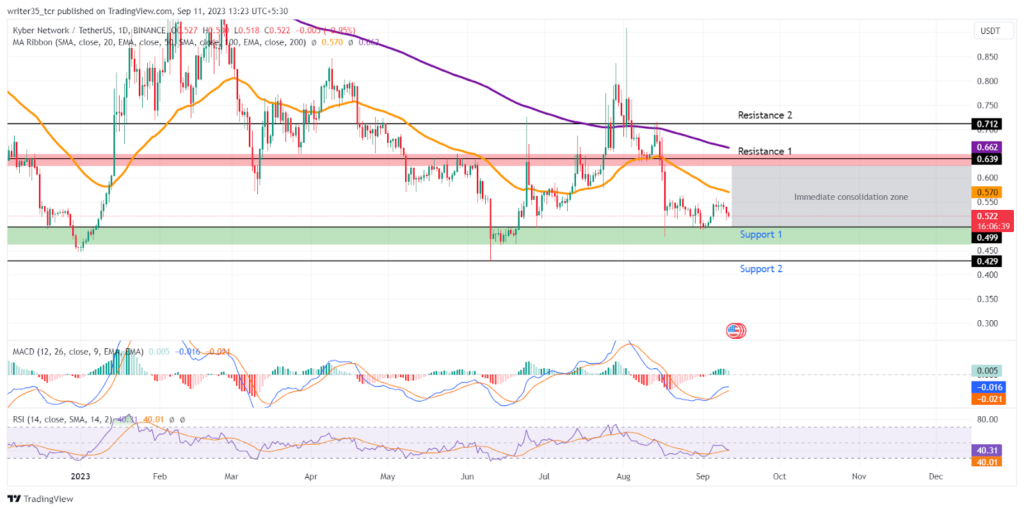
At the time of writing, the KNC coin has broken a major support level and it is at the level of $0.52. The coin has bounced off its immediate resistance level of $0.429 recently after coming down. The immediate resistance for the bulls will be at $0.639 and if they break past it, another resistance will be at $0.172. On the other hand, the second support level for the coin is at a weak volume zone of $0.429.
What indicators are showing
Past these supports and resistances, the MACD is showing an uptrend after a bullish crossover with its EMA line back on 5th September 2023. This has created current levels of MACD and its EMA at -0.016 and -0.021 respectively.
The RSI is showing a significant rise after touching its oversold level of 32 back at the start of this September. At present, the RSI is moving towards a neutral territory while its SMA is following it from underneath.
The EMAs are above the KNC coin price due to a downtrend. The 50 EMA is currently at a level of $0.57 and is rejecting the bulls frequently. The 200 EMA is at the level of $0.66, above the immediate resistance.
Conclusion
Based on the current market situation, the ONT coin price is likely to experience a bullish trend if it manages to rebound from the immediate support level of $0.499. However, the bulls will need to surpass 50 EMA first, to reach the immediate resistance level. On the other hand, if the market turns bearish, the price could drop to its second support level at $0.429.
Technical Levels
Support: $0.499,$0.429
Resistance: $0.639, $0.712
Disclaimer
The views and opinions stated by the author, or any people named in this article, are for informational purposes only. They do not establish financial, investment, or other advice. Investing in or trading crypto assets comes with a risk of financial loss.


