

· Qtum coin’s total market value declined by over 10% per the Lunar Crush.
· Qtum coin price has fallen by over 27% in the last six months.


The coin’s price has steadily dropped, creating a pattern of lower-lows and lower-highs. This pattern has resulted in a formation of descending triangle pattern, and the price moving within this pattern. This indicates a negative trend and signifies a downtrend in the market.
Financial Data of Qtum coin (QTUM)
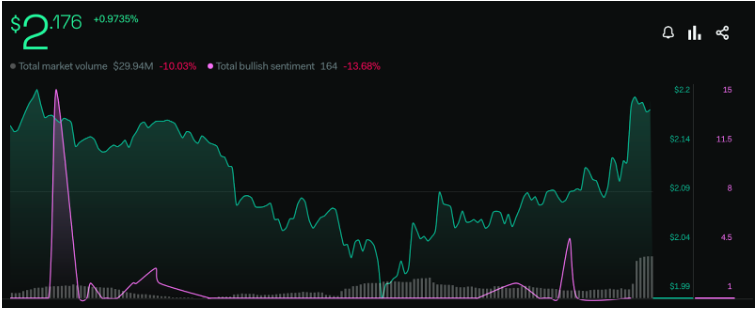
According to Lunar Crush, the QTUM coin is showing negative signs. Currently, the trading volume stands at $29.9, marking a 10% decrease. Additionally, the overall bullish sentiment has dropped by 13%, indicating a negative trend in the coin’s price.
The QTUM coin reached a peak of $106.88 but has been continuously declining since then, dropping by over 97% by the end of January 2023. The coin’s price is moving near a support level, showing a period of consolidation around this point. This movement has formed a descending triangle pattern, typically seen as a negative sign, suggesting a potential break of the support level and further price decline.
The QTUM coin has given a return of -27% in the last six months. The overall past performance of the coin could be better. The price is making a poor structure. The price is likely to show further negative momentum.
Qtum coin Technical Analysis
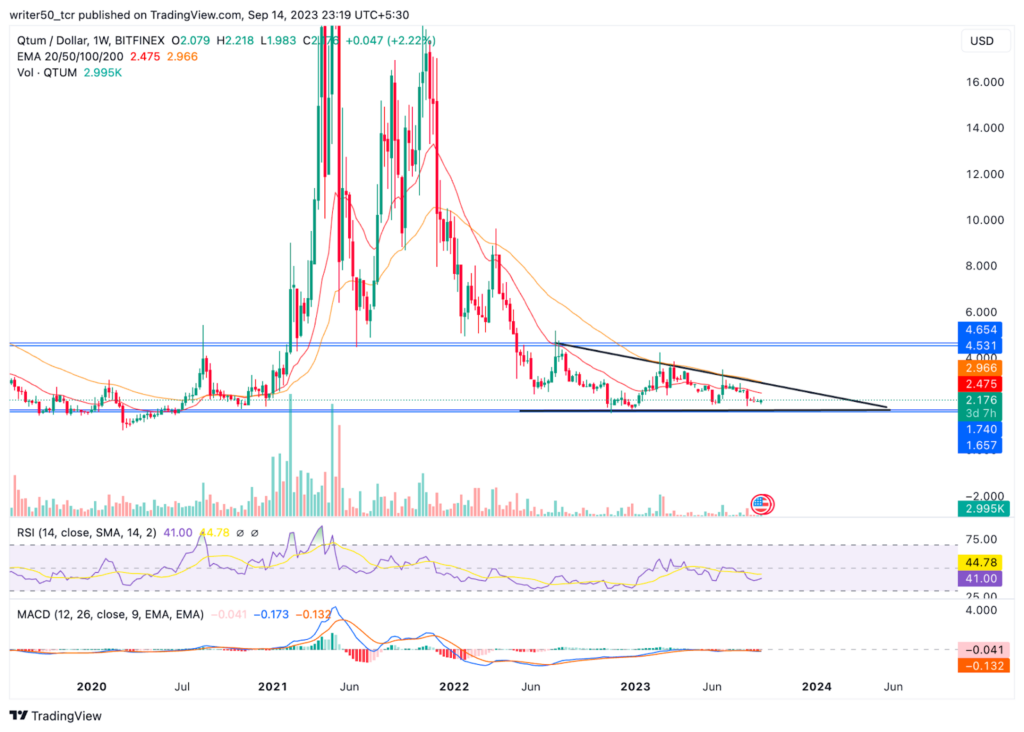
QTUM has experienced a prolonged period of declining prices, indicating a downtrend in the market. The pattern further confirmed this decline, where the 50-day EMA crossed below the 200-day EMA, suggesting market weakness.
The RSI value has consistently remained below 50, indicating a steep downtrend. This trend continues without any signs of bullish divergence or the presence of buyers in the market.
The QTUM coin’s MACD line is below the signal line, and the chart has a red histogram. This suggests a weak signal for the coin, indicating a possible price decline.
Conclusion
In conclusion, the Qtum coin displays a bearish pattern on the charts. It’s trading below the EMA levels, and the RSI is in the negative zone. The coin’s structure appears weak, and the bearish sentiment is rising. Given these conditions, it’s likely that the price will decrease.
Technical Level
· Support Level: $1.7
· Resistance Level: $3.8
Disclaimer
The views and opinions of the author or anyone in this article are for informational purposes only. They do not offer financial, investment, or other advice. Investing or trading crypto assets involves the risk of financial loss.


