

- The AAF stock price is trading at 114.1 GBX.
- It is currently trading above its historical support of 104 GBX.
- The Airtel Africa stock has been traded with a volume of 2.748 Million in the last trading session.
Airtel Africa Plc (LSE: AAF) was founded on 12 July 2018. It is an Indian telecom company located in Africa. It provides services like telecommunication and money services. The company runs through three segments, which are Mobile Voice, Mobile Data, and Airtel Money.
Airtel Africa Plc (AAF) Stock: Financial Analysis
Over the last three years, Airtel Africa’s revenue has increased consistently. Rising from 2.98 Billion GBP in 2020 to 3.45 Billion GBP in 2021. It showed a growth of 15.92% compared to the previous year. In 2022, the company increased its revenue to 4.37 Billion GBP with a growth of 26.53% compared to the previous year.


In 2020, the company’s net income declined by 10.90% with a generated net income of 259.60M GBP. It managed to increase its net income to 461.98 Million GBP in 2021. It showed a growth of 77.96% and recovered from its previous year’s decline. The company increased its net income to 550.96 Million GBP in 2022. It experienced a growth of 19.26% compared to its previous year.
The company started paying dividends to its shareholders in 2019 with an average dividend payout ratio of 40.75. The firm has also managed to increase its EPS over the last three years.
Airtel Africa has shown consistent growth over the years in its financials.
Airtel Africa Plc (AAF) Stock: Technical Analysis
From the start of the year 2023, the AAF stock price has been trading over the support of 104 GBX. In May 2023, the price initiated a bullish rally from the support and made the 2023 high of 135.8 GBX. The stock price started facing rejection after reaching 135.8 GBX level and started falling.
The price fell back to 104 GBX support and is currently trading inside a symmetrical triangle pattern. Now, if the stock price gives the breakout of the 120 GBX resistance, it may rise to its next resistance at 134 GBX.
Suppose the price breaks below the 104 GBX support zone, it may fall to its next support at 93 GBX. Otherwise, the price could trade within the range of 120 GBX to 104 GBX.
Technical Indicators’ Prediction About the Current Trend
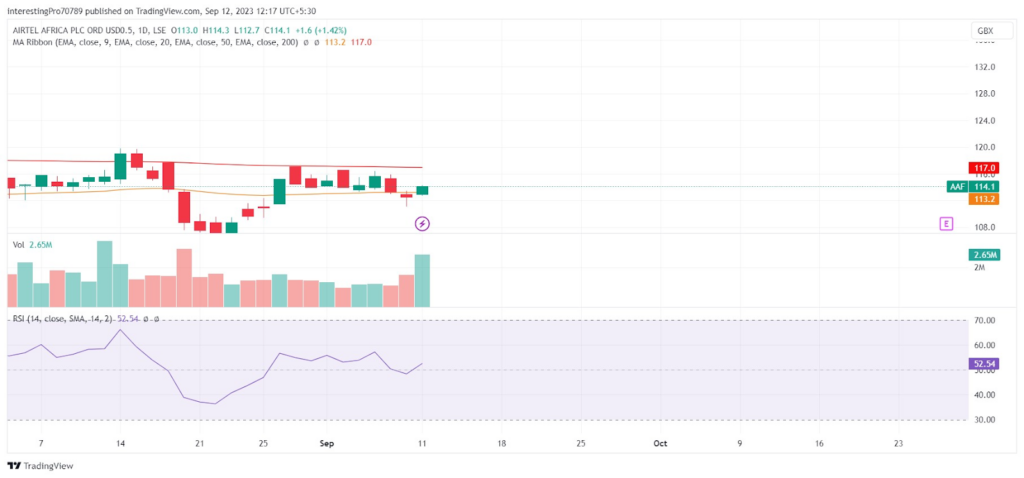
The AAF share price is trading in between 50 and 200 EMAs. It shows that the stock has been pressurized by both sellers as well as buyers due to which the future trend is unpredictable.
The relative strength index is at 52.54. The RSI line is in natural territory suggesting that the price is currently in an indecisive state.
Conclusion
Airtel Africa Stock is currently indecisive as the price is making higher lows as well as lower lows. The price is trading in a range of 120 GBX to 104 GBX. If it gives a breakout of the 120 GBX resistance, it may rise to its next resistance at 134 GBX.
If the price breaks below the 104 GBX support zone, it may fall to its next support at 93 GBX. Otherwise, the price could seen trading inside the range of 120 GBX to 104 GBX.
Technical levels
Resistance levels: 120 GBX and 134 GBX.
Support levels: 104 GBX and 93 GBX.
Disclaimer
The views and opinions stated by the author, or any people named in this article, are for informational purposes only. They do not establish financial, investment, or other advice. Investing or trading comes with a risk of financial loss.


