

- Bitcoin Cash coin price is trading at $198.9.
- The price has recently retested $224.5 level after giving the breakdown of this level and is sustaining below it.
- The price is in the range of $180 to $225.
- The coin has been traded with a volume of $240,315,871M in the last 24 hours.
Bitcoin Cash (BCH) Coin: Technical Analysis
The Bitcoin Cash price was stuck in a range of $89 (support) to $155.8 (resistance) for almost two years. In June 2023, the price initiated a strong bullish rally from the $89 support and gave the breakout of the range of $155.8 resistance. The price went up and made the 2023-year high of $329.
After reaching to $329 level, it started to face rejection and fell to the $225 level. The price tried to sustain over the $225 level, but it failed to do so. The price gave the breakdown of $225 and fell to the $180 level.


After reaching the $180 level, it formed support over there and initiated a bullish rally to $225 level. The moment the price reached there, it faced rejection and again fell back to the $180 support zone.
Currently, the BCH Price is trading above the $180 support zone. If it sustains above the $180 support and gives the breakout of $225 resistance, it may rise to its next resistance at the $255 level.
For the price to be in bearish sentiment, it must have broken below the $180 support. Thus, it may fall to its next support at the $155.8 level. However, if the price gave the breakdown of the $155.8 support, it may fall to its historical support at $89 level. Otherwise, the price could trade in a range of $180 to $225.
Technical Indicators’ Prediction About the Current Trend
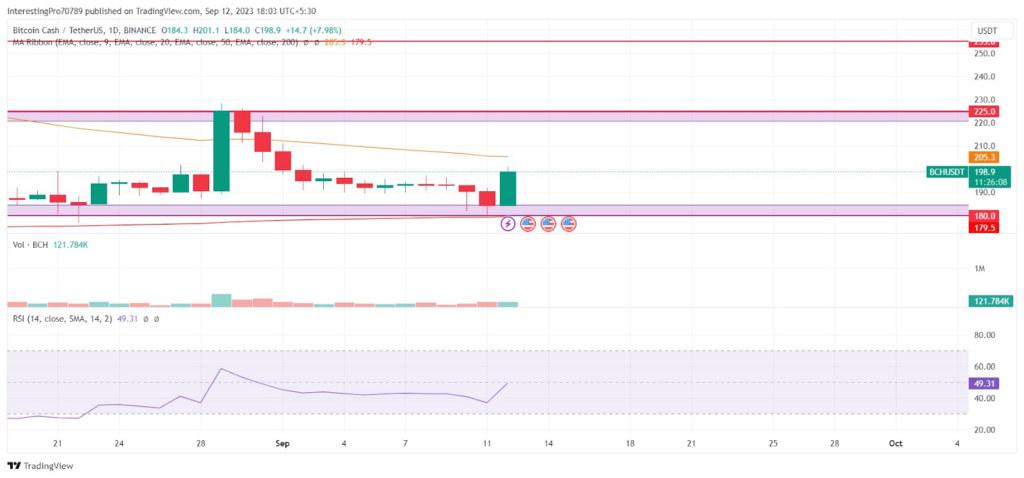
The BCH token price is currently trading between the 50 and 200 EMAs. That indicates the price is being pressurized by sellers as well as buyers.
The relative strength index is at 49.24. The RSI line is in neutral territory but the sellers’ influence is slightly more than the buyers. The RSI line is trending in the upward direction. If it crosses the 50 levels of RSI, the buyers will get activated, creating a balance between buyers and sellers.
The long/Short ratio of Bitcoin Cash shows that both long positions are placed more than the short positions in the last 24 hours. The long positions are of 52.58% and short positions are of 47.42%.
Conclusion
The Bitcoin Cash / TetherUS (Binance) chart is neutral at the time of writing. The price is trading in a range of $180 to $225. The chances of the price to commence a bullish rally are only when it reclaims the $225 resistance. However, if the price breaks below the $180 level, it may be seen falling. Otherwise, the price will trade in the range of $180 to $225.
Technical levels
Resistance levels: $225 and $255.
Support levels:$180, $155.8 and $89.
Disclaimer
The views and opinions stated by the author, or any people named in this article, are for informational purposes only. They do not establish financial, investment, or other advice. Investing or trading in crypto comes with a risk of financial loss.


