

- UK’s IMI stock price dropped after the release of the H1-2023 report.
- IMI stock surged 0.95% during the intraday session and is trading at £1493.
IMI stock is trading at £1493 while witnessing a gain of 0.95% during the intraday session. The current market sentiment indicates that sellers dominate the price. However, according to press day results, the price is controlled by buyers. If this remains constant, the price might hike towards the £1530 mark.
On the other hand, the 50 and 100-day EMAs indicate that the IMI stock price is in an oversold zone, and the price might face a further downfall if sellers’ participation increases in the market.


Year-to-date (YTD), the stock jumped by 17.28%, but the price has faced a downtrend after reaching the annual high of £1687. When stock hit an annual high, it was dragging in a consolidation zone between £1687 and £1566. However, bearish dominance melted the price down to the support level of £1504.
Moreover, the heavy presence of bulls at £1504 prompted the price towards the £1661 resistance level. The following day, announced its H1-2023 financial report, which dropped the price of IMI stock.
H1-2023 Financial Report of IMI PLC
IMI PLC announced its first half-yearly financial report on 28 July 2023. The reported earnings per share (EPS) of £0.54 bypassed the estimated EPS of £0.53 by a surprise of 1.05%.
However, the reported revenue of £1.08 Billion failed to meet the estimated £1.10 Billion revenue, with a slight difference of 1.34%. The H1-23 report encouraged the sellers, and the price melted roughly 12%.
Will IMI Stock Retest £1530 Mark?
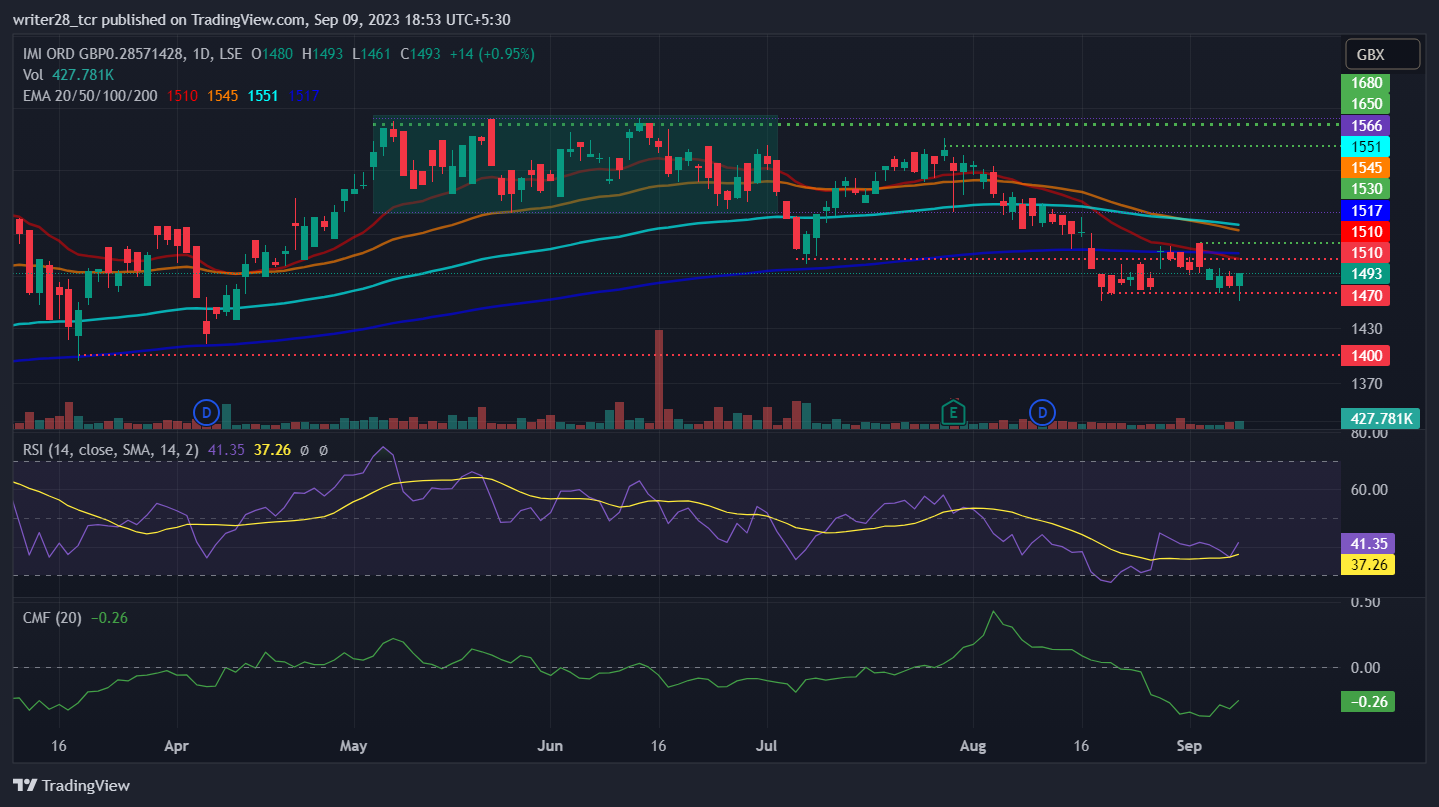
The stock price is hovering below the 20, 50, 100, and 200-day EMAs, indicating the downtrend in the price action, and the price is in the oversold region.
The current score of RSI is 41.35 points, denoting that the stock price is facing bearish momentum in the market. However, there is a possibility of a relief in the price action soon.
The CMF (Chaikin Money Flow) score is -0.26, denoting that both the short-term and long-term trends are in a downward direction and that the sellers’ participation in the market is rising.
Conclusion
The market scenario of IMI stock suggests that the price is facing intense weakness in the market, while the current month’s returns reflect a decline of 5.74%. The share price is oversold and might face a short-term pullback. The technical parameters indicate that the price is held in a bearish grip, so investors should look for selling opportunities.
Technical Levels
Major resistance: £1661 and £1687
Major support: £1273 and £1394
Disclaimer
The views and opinions of the author or anyone in this article are for informational purposes only. They do not offer financial, investment, or other advice. Investing or trading crypto assets involves the risk of financial loss.


