

- The NXT stock price is trading at 7148 GBX.
- The price is consolidating in range after a strong bullish rally.
- The stock has been traded with a volume of 47.465K in the last trading session.
Next Plc (LSE: NXT) was founded by Joseph Hepworth in 1864. It is a clothing, footwear, and home products retail company that deals in the sale of accessories for men, women, and children.
Next Plc (NXT) Stock: Financial Analysis
Next Plc’s revenue showed consistent growth over the last three years. In 2020, the company’s revenue was around 3.53 Billion GBP. In 2021, it managed to increase its revenue to 4.63 Billion GBP with a growth of 30.88%. 2022, the company generated 5.03 Billion GBP in revenue, which showed a growth of 8.82%. The firm’s trailing twelve-month revenue for 2023 is running at 5.03 Billion, which is the same as the previous year.


The company has shown consistent growth in its net income over the last three years. In 2020, it generated a net income of 286.70 Million GBP, whereas in 2021, it showed a growth of 136.31% with 677.50 Billion GBP in its net income. In 2022, the firm increased its net income to 711.70 Million with a growth of 5.05% compared to its previous year. The company’s trailing twelve-month net income is running at 711.70 Million GBP which is the same as the previous year’s net income.
The company has been slowly decreasing its total debts from 2020 to 2021. The company has also been increasing its earnings per share (EPS) each year from 2020 to 2022. The Next Plc has been a little inconsistent while paying dividends to its shareholders.
Overall, the company’s finances have been growing consistently over the last three years. The company seems to be moving in a healthy run since 2020.
Next Plc (NXT) Stock: Technical Analysis
In October 2022, the Next Plc Stock price formed support at 4337 GBX and commenced a bullish rally up to 7076 GBX. After reaching there, the price started to face rejection and fell to 6120 GBX. Subsequently, the price got stuck in a range between 6730 GBX to 7244 GBX.
After a strong bullish rally, the price has been consolidating in a range, which is an excellent sign for price movement. This indicates the possibility of another bullish rally.
The price is currently trading below the 7244 GBX resistance zone. As long as the price sustains above the 6730 GBX, the chances are high for the price to give the breakout of the 7244 GBX resistance level. It might even rise to its next resistance at 7644 GBX.
However, if the price breaks below 6730 GBX, then it may fall to the 6120 GBX support level and if it also breaks the 6120 GBX support, then it may fall to 5482 GBX. Otherwise, the price could be seen trading within the consolidation zone for some time.
Technical Indicators’ Prediction About the Current Trend
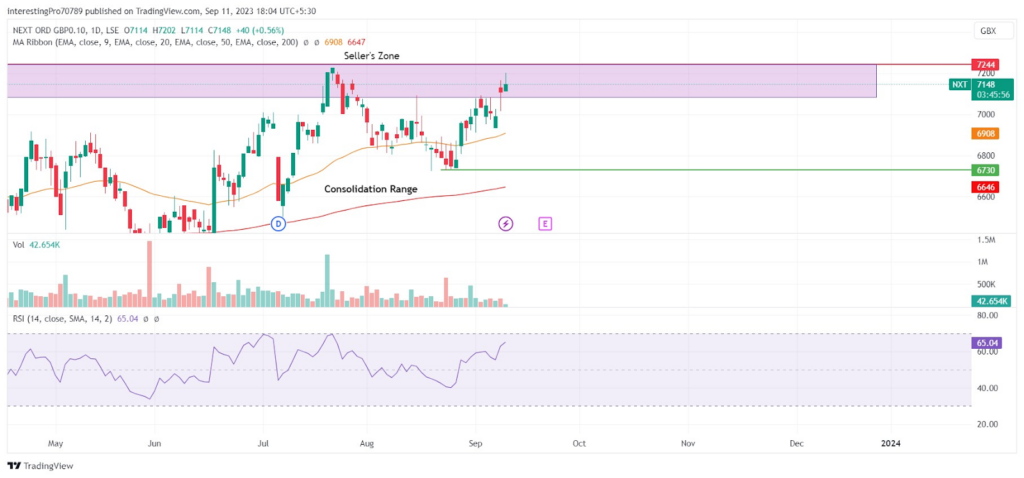
Next Plc Stock is trading above the 50 and 200 EMAs, indicating the bullish sentiments and the control of buyers over the price.
The relative strength index (RSI) is at 65.04. The RSI line is in bullish territory, indicating that NXT price is under the control of buyers.
Conclusion
The overall chart of NXT is indicative of bullish sentiments. The price is in a consolidating zone after a strong bullish rally. This could be considered a good sign for the price to continue its bullish rally. As long as the price sustains above the 6730 GBX support level, the chances are high for the price to give the breakout of the 7244 GBX resistance level. The price might even rise to its next resistance at 7644 GBX.
If the price breaks below 6730 GBX, then it may fall to the 6120 GBX support level and if it also breaks the 6120 GBX support, then it may fall to 5482 GBX. Otherwise, the price could be seen trading within the consolidation zone for some time.
Technical levels
Resistance levels: 7244 GBX and 7644 GBX.
Support levels: 6730 GBX, 6120 GBX and 5482 GBX.
Disclaimer
The views and opinions stated by the author, or any people named in this article, are for informational purposes only. They do not establish financial, investment, or other advice. Investing or trading comes with a risk of financial loss.


