

Key Points:
- Twilio eroded more than 85% of wealth from highs
- The stock has been in a consolidation phase for the last year
- The company’s income consistently declined over years
Market Capital of Twilio (TWLO): $11.96 Billion
Current Market Price of Twilio (TWLO): $66.08


How the Stock Price Has Reacted Till Now?
The stock was listed in 2016 near the price of $25 and within 5 years of listing the stock gave a massive return of more than 1900%. It gave a wonderful reward to its investors for their patience, but this happiness didn’t last long as the price saw a massive sell-off from higher levels. The stock price came down and it is now trading about 85% off highs.
A major reason for this bearish move is the continued decline of the net income of the company over years and years
Technical Analysis on a 1-Week Time Frame

The price is trading near to the range from where the stock showed a wonderful rally toward the level of $450. For the long-term investors, it was a roller coaster ride in 7 years of its journey. The stock price saw a massive jump and manifold the investment of the investors. It is again trading back to the levels from where it started.
The price is consolidating in a range where it is trading below all three EMAs i.e. 50-day, 100-day, and 200-day and the slopes of the EMAs are downward, which shows that the stock is currently in the sellers’ grip.
Technical Analysis on a 1-Day Time Frame
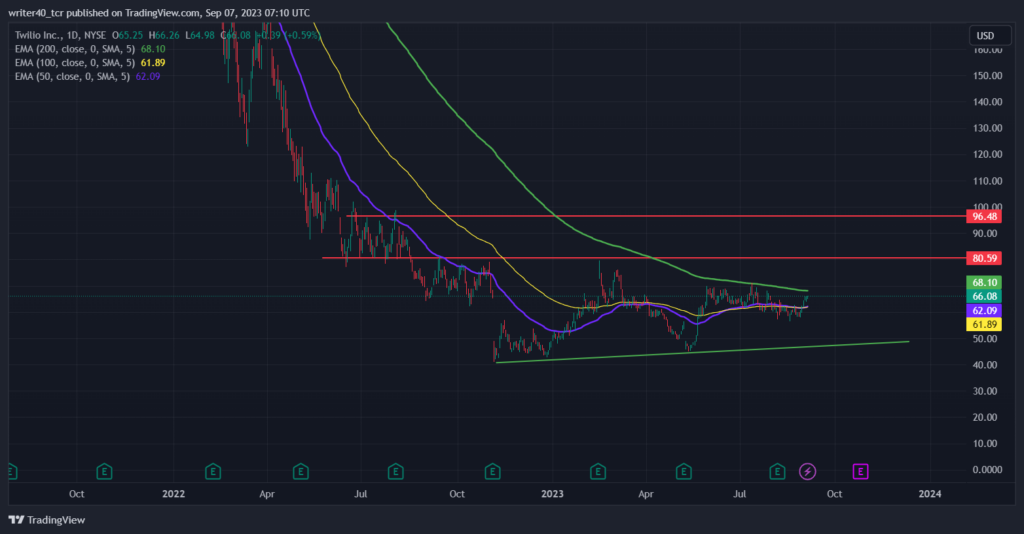
The stock price is currently struggling between the EMAs, which is a sign of major consolidation where the 200-day EMA is acting as a major hurdle for this stock. The other two EMAs i.e. 50-day and 100-day are acting as a support.
If we talk about the supply and demand zone, then the demand zone is present as a trendline that is sloping mildly upward at the level of $50. The supply zone is present at $80 and $96 levels.
Technical Analysis on a 1-hour Time Frame
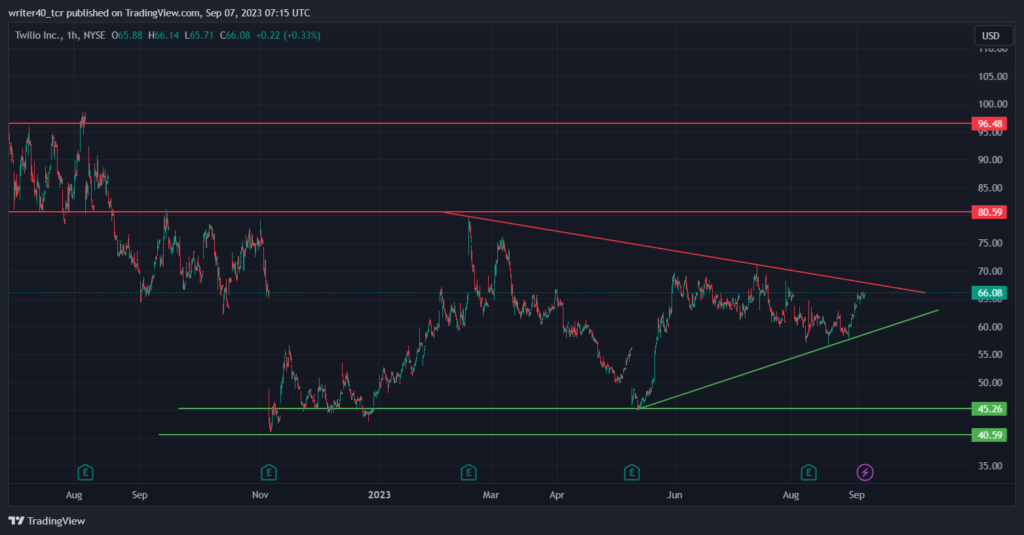
The price forms a symmetrical triangle pattern where the resistance is present at a trendline near the $67 level. The support as a trendline is present at the level of $58.
If the pattern breaks on either side then the levels we watched for are as follows:
The next demand zone for the price of this stock is present at the levels of $40.59 to $45.26. The supply zone for the price is present near the levels of $80 and $96.
Conclusion
As the stock has been in a consolidation phase for so long, it can break any of the levels whether upside or downside.
To move up, the stock should breach the level of $80. If it breaches the near-term support, it can unlock the lower levels of $ 40.
Past Performance
1 Week: 10. 02 %
1 Month: 7. 59 %
1 Year: – ( 1.46) %
Technical Levels
- Resistance- $ 80 and $ 96
- Support – $ 60 and $ 45
Disclaimer
The views and opinions stated by the author, or any people named in this article, are for informational purposes only and do not establish financial, investment, or other advice. Investing in or trading crypto assets comes with a risk of financial loss.


