

- The Rose coin price has surged up by 13.22% in a week and 2.39% in a month.
- The Rose coin price is trading below its 50 and 100 Exponential Moving Averages.
- This coin price has melted down over 92% from its high which it created in Jan 2022.
The market capital of The Rose coin – $277.092 Million
The current market price of Rose coin – $0.04234


Coin Overview
In the current session, the price of the Rose coin is trading in a positive trajectory and is up by $0.00073 (1.66%) indicating that the buyers are showing some strength to push the price up. The coin has surged over 13% in a week which shows that the price is gaining some momentum at lower levels.
The Rose coin price has melted down over 92% from its all-time high of $0.598 which it created in Jan 2022, which indicates that the price has given some nightmares to the investors. The coin price has risen by 2.39% in a month which indicates that the buyers have an upper hand in the short-term trend but the price declined over 25.74% in a year indicating a long-term bearish trend.
The price is consolidating inside the range of the big bearish candle formed on 17 August, since then the price has been consolidating inside that range of $0.04473 and $0.3767. The price is waiting for this range to break on either side which can clear the direction of the price for the near term.
Technical Analysis of the Rose Coin:
The Rose coin has formed a falling wedge pattern on the daily time frame and it looks like the price has already given a breakout of that pattern on 15th September. The price has retested the pattern breakout and cleared out the swing high of the breakout. The price has surged for 6 out of the last 8 trading sessions which indicates a strong bullish momentum.
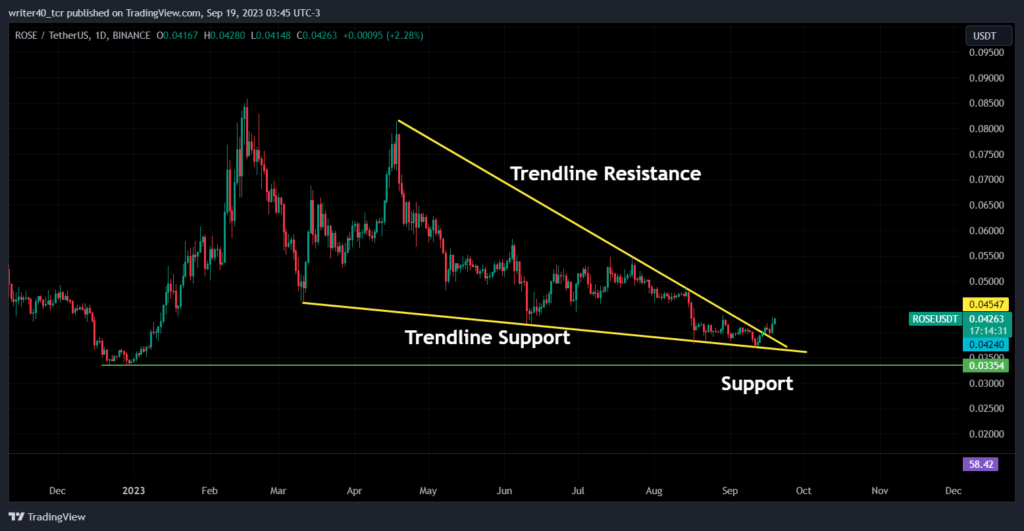
The Rose coin price symmetrical triangle support is $0.03630 which is very close to the horizontal support level of $0.03316. The levels are very close to each other which can create a strong demand zone at that level. The price has crossed the trendline resistance level which can also act as a slight support to the price.
Price now can try to target the seller’s zone present near the area of $0.04848, a zone from where heavy selling was witnessed in the August series. The overall crypto market is showing some bullishness at the current price which can lead to a good upside momentum for the prices of coins.
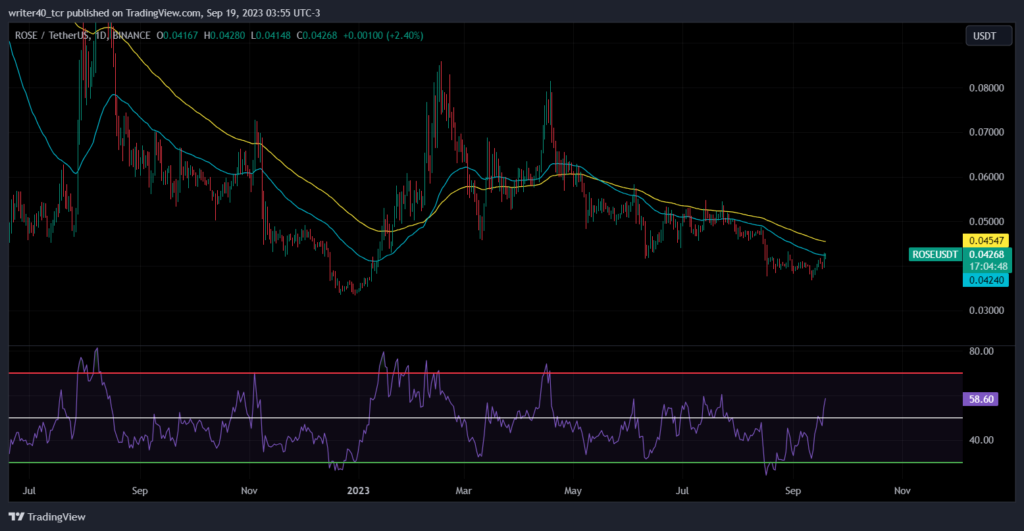
The price is trading below both the important EMAs of 50 and 100 which is a sign of a bearish trend but the price is now challenging the seller who uses the 50 EMA indicator for trading. The slope of the EMA is slightly down which can provide some resistance to the price but the price is looking strong near these levels.
The relative Strength Index is currently at 58.60 which indicates that the price is in a good upside momentum and the RSI is sharply moving up indicating that the price can further witness this momentum on the upside.
Conclusion
As the price has given a breakout of a symmetrical triangle and retested the level. We can expect a move on the upside as the RSI is near 60. Which means the momentum is strong in this coin. 50 and 100 EMA can slightly provide some resistance to the price. But it seems like the price is ready to breach the EMA level to move towards the $0.04830 level.
Technical Levels:
Resistance – $0.04473 and $0.04848
Support – $0.03630 and $0.03316
Disclaimer
The views and opinions stated by the author, or any people named in this article, are for informational purposes only. They do not establish financial, investment, or other advice. Investing in or trading crypto assets or stocks comes with a risk of financial loss.


