

- HD stock price is consolidating in a range between $340 and $280.
- HD stock price has declined 3.65% in a week and 2.40% in a month.
- The revenue of the company has risen every year since 2016.
Market Capital of the Home Depot stock: $317.281 Million
The current price of Home Depot stock: $317.26


Stock Overview:
In the previous session i.e. 18 September, the price of HD stock fell $4.14 (1.29%) showing that the price has witnessed some selling pressure. In the last 2 sessions, the price has declined by over 3% which is a sign that some active sellers are present near the resistance area of $328 – $336.
The stock has declined by 3.65% in a week and 2.40% in a month which shows that the sellers are more aggressive than the buyers in the shorter time frame. Although the price has surged 17.92% in a year indicates that the stock is still in a bullish trend on the broader horizon.
The stock is currently consolidated in a broader range of $340 and $280, and it’s more than a year now since the price is trading between this range. The price reached an all-time high of $401 in Dec 2021 and is still trading 21% below that level.
The revenue of the company is showing a good upside every year as the revenue was at $94.59 Billion in 2016 and is not standing at $157.40 Billion in 2022. The company maintained the pace of revenue growth every year and showed some positive surprises in Financial every time.
The net income of the company was $7.96 billion in 2016 and is now standing at $17.11 billion in 2022. The net income of the company has increased every single year and jumped by 114.82% in 6 years which is just remarkable. The Net debt of the company has also risen at a good pace from $21.60 billion in 2016 to $47.61 Billion in 2022.
Technical Analysis of Home Depot (HD) stock
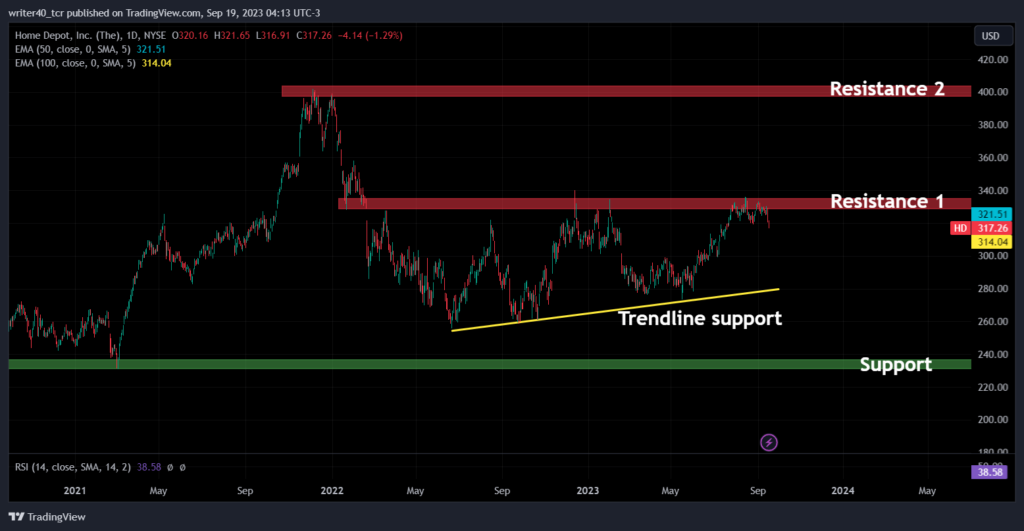
HD stock price is currently forming an ascending triangle-like pattern on the daily chart as the support of the price is shifting upwards. The price is facing rejection from the resistance area near the price of $335- $340. The price is facing rejection at this level for the third time which indicates that the resistance will get weaker from now on with every attempt.
HD stock price is falling sharply from the resistance level and heading towards the support level which is present at the trendline support of the rising trendline present near the level of $280. The next support is visible near the level of $231 and $240. The second resistance is present near the price of $400 i.e. the all-time high.
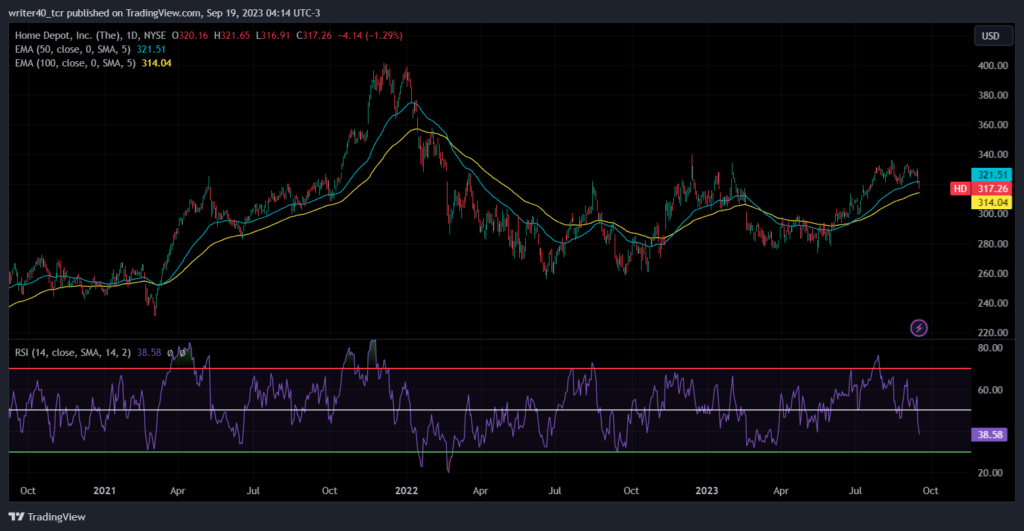
The price is currently trading above the 50 and 100 EMA levels which is a sign of bullishness. The slope of the EMAs is also up is a good sign for the bulls. However, the Relative Strength Index (RSI) is currently present at 38.58 level which shows that the price is not favouring the bullish sentiments and favouring the sellers.
Conclusion
The price is consolidating in a broader range as we have discussed above. The price is currently trading near the resistance and facing a strong rejection, as the stock is sideways for one year so we can expect that the price can head toward the trendline support level which is present near $280.
Technical Level
Resistance – $340 and $400
Support – $280 and $240
Disclaimer
The views and opinions stated by the author, or any people named in this article, are for informational purposes only. They do not establish financial, investment, or other advice. Investing or trading comes with a risk of financial loss.


