

- 0x is a decentralized infrastructure exchange that helps in exchanging the tokenized assets on the blockchain.
- ZRX is an ERC-20 token, the staking and governance token of 0x. It was developed by Amir Bandeali and Will Warren.
- In August 2017, they came up with the Initial Coin Offering(ICO) and raised $24 Million in 24 Hrs.
The COO of PayPal joined 0x’s advisory board in April 2018. It was the first ERC-20 token that started trading on Coinbase on 11 October 2018.
ZRX token was included in the crypto assets for the DeFi index fund. It raised 15 Million led by Pantera Capital in a Series A round in 2021.


Bitwise, creator and manager of the world’s largest crypto index fund added ZRX to its portfolio on 17 February 2017.
It touched an all-time high on 13 April 2021 which was$2.3041 and touched an all-time low on 17 March 2020 which was $0.1371.
Technical Analysis of ZRX
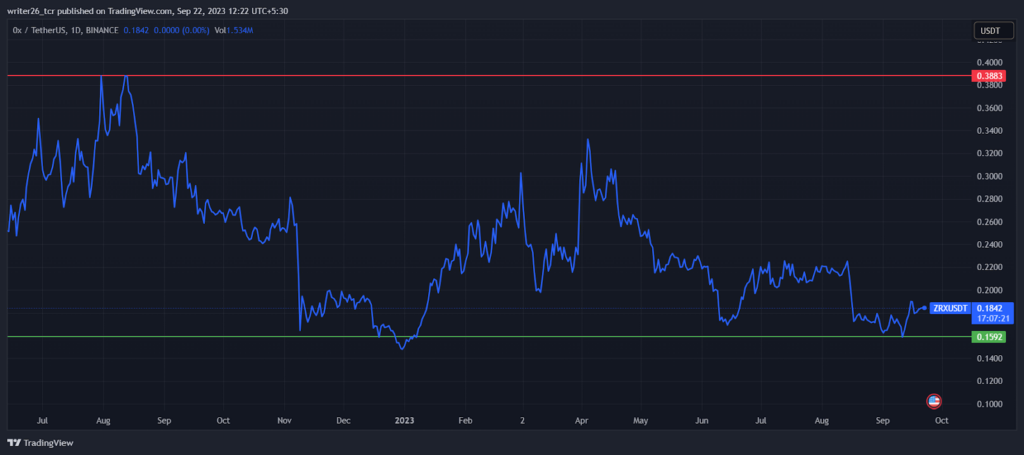
The image indicates that the token is ranges between two levels. The green line is known as the Support Level.
The red line is known as the “Resistance Level”. The token is not able to break the resistance level but it has broken the green line.
According to some forecasts, the short-term or current market sentiments are neutral.
The prices might rise up $0.203937 which is around 10.09% by 27 September 2023. Over the last 30 days, the price volatility was 3.95%.
In the last 30 days, ZRX recorded 15/30 green days which means 50% days were bullish.
The F & I Index(Fear & Greed Index) is showing 43(Fear). It is a good time to buy a ZRX token.
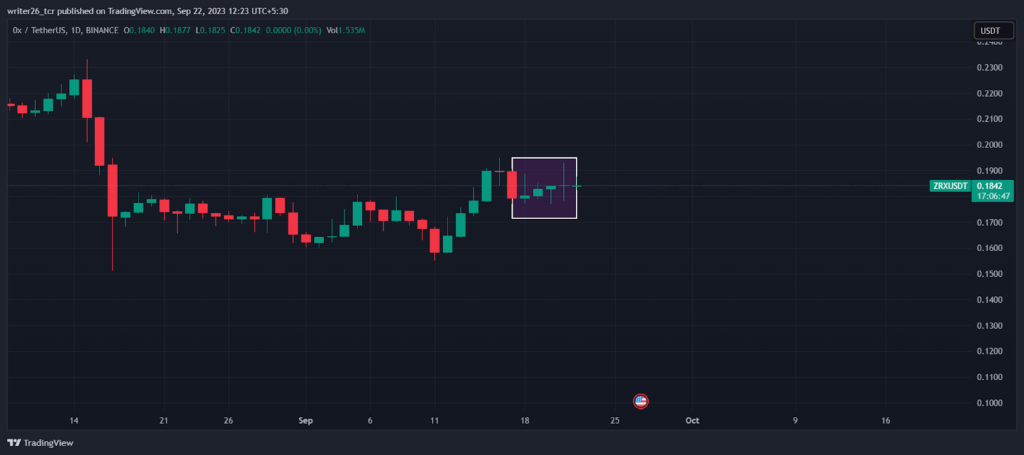
The pattern near the current market price is known as “Three White Soldiers”.
It indicates that the price might start to rise or start to move in the upward direction. In today’s session, it was down by (0.30%). It fluctuates every 10 seconds.
If it trades between the range of $0.204753 and $0.151963 and reaches up then it might increase by 11.29% in 2023.
Price Prediction of ZRX (2024-2030)
| Year | High | Low |
| 2024 | $ 0.323458 | $ 0.142184 |
| 2025 | $ 0.764517 | $ 0.197667 |
| 2026 | $ 0.481465 | $ 0.176185 |
| 2027 | $ 0.203545 | $ 0.149286 |
| 2028 | $ 0.443291 | $ 0.082707 |
| 2029 | $ 1.346077 | $ 0.185817 |
| 2030 | $ 0.766710 | $ 0.141845 |
Live chart of ZRXUSDT
Summary
Through technical analysis,we can conclude,
In the daily time frame, the token is in a range. Investors should wait for the breakout.
In the weekly and monthly time frames, the token is in a sideways position.
In the yearly time frame, the token is forming a triangle which means first it was going up but after some time it started to retrace.
The bears are trying to enter into the token. So, the price may move down and it may break the support level. The price may fall in the future.
Crypto investors should have proper knowledge about the cryptocurrency market.
Levels
Resistance Level- $0.3883
Support Level- $0.1592
Disclaimer
The analysis is done for providing information through technical analysis and no investment suggestions are given in the article to be made by investors.
The coins are unpredictable so investors should have proper knowledge.
Cryptocurrencies are highly volatile and risky. Investment should be made with proper technical analysis.


