

- APT is a layer 1 blockchain technology that uses Move Programming Language. It helps in increasing scalability, security, reliability, and usability.
- APT was founded in 2021 by Mohd. Shaikh. Overall the token is performing very well.
- Let’s analyze APT through technical analysis and withdraw some information about it.
APT initially was performing very well. On 26 January 2023, it started its downward journey.
According to forecasts, Apt is bearish and it is predicted to increase to $5.16 price level in today’s session.


APT is showing downtrend situations in every time frame except yearly. Overall it is in an uptrend in the yearly time frame.
It is down by (38.48%) overall but it is fluctuating continuously due to changes in the price. In today’s session, it is down (0.15%) which is also changing every minute.
In this article, we will predict as well analyze the price of APT through technical analysis.
Technical Analysis of APT
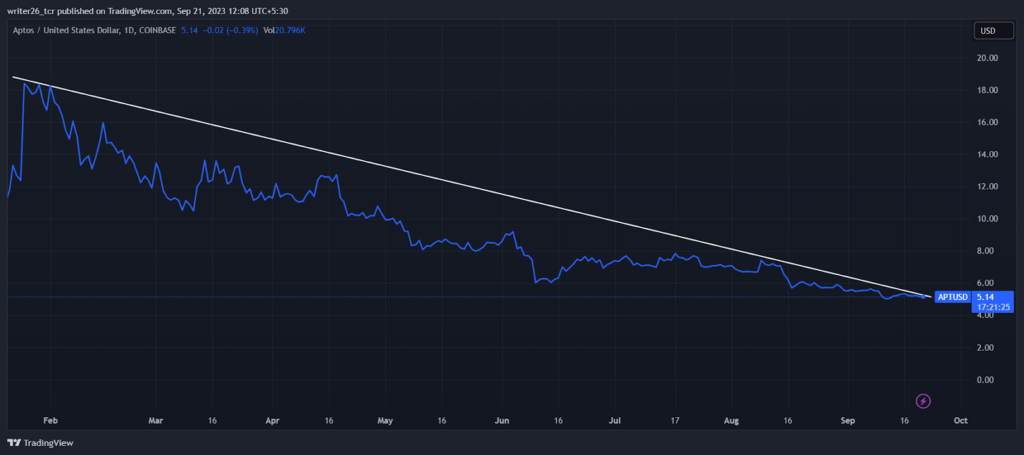
The coin is in the downward direction. It might continue to fall in the future. As it might make another resistance on the downtrend line.
The coin from the beginning of 2023 is falling. It made multiple resistance points on the trend.
The image indicates that the coin made a strong resistance trend. The coin was able not to break that trend. It never went above the line.
According to Coincodex, the F & I Index(Fear & Greed Index) is showing 47(Neutral). The price volatility over the last 30 days was around 4.77%.
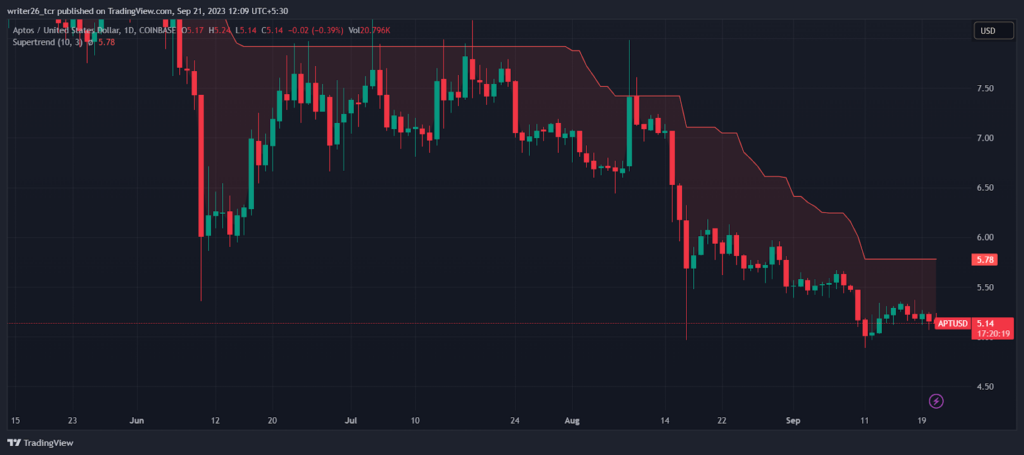
In the image, it is clear that the coin is continuously moving in the down direction. It recorded 15/30 green days which is around 50% in the last 30 days.
The coin might go down by (6.96%) which means it can go down to $4.80 price level by 25th September 2023.
Is it a good time to invest in an APT?
It might be a good buy as it partnered with Microsoft(MSFT). The coin may show some recovery after its partnership.
In recent times, the token has performed badly but in the long-term there is the potential for the rise.
It is good for a longer time frame but not good for short-term investment. The price might rise by 5.84% which is around $6.93 by 23rd September 2023.
The current market sentiments are bearish. It is important to focus on both technical and fundamental analysis.
Live chart
Summary
Through the technical analysis, we can conclude that the coin is performing well in the yearly time frame.
In the daily time frame, it is in a downtrend position. In the monthly time frame, according to Candlestick. It may move lower in the future due to the three black crows pattern.
In the weekly time frame, it is in a sideways position. Overall it is good for long-term investment not for short-term investment.
Crypto investors should have proper knowledge about the cryptocurrency market.
Levels
Resistance Level- $13.73
Support Level- $4.02
Disclaimer
The analysis is done for providing information through technical analysis and no investment suggestions are given in the article to be made by investors.
The coins are unpredictable so investors should have proper knowledge.
Cryptocurrencies are highly volatile and risky. Investment should be made with proper technical analysis.


