

- The RIVN share price is trading in an uptrend leading to higher levels.
- Rivian Automotive Inc. share price is more volatile than the overall market.
Rivian Automotive Inc (RIVN) is one of the most famous electric vehicle (EV) stocks in the market. The company was established in the year 2009, listed on the Nasdaq on Nov. 10, 2021, at an initial offering price of $78 per share. The company raised $12B in funding. The shares started trading on the Nasdaq under the ticker “RIVN” with an opening price of $106.75.
RIVN stock has an average volume of 50.35M with 938M shares in the market for trading. The stock’s beta is 2.32 which makes it more unstable and this shows that the stock moves more than the market overall.


The stock has a negative PE ratio of -3.76 and the company’s ROE is also negative at -44.69% which indicates that the investors are willing to pay less price for the share of the company.
The company’s gross profit has increased by 208.00% to $1.12B after a decline of 35.6% year-on-year for Q2 2023. The return on assets has also declined by -39.00% and the RIVN company’s long-term debt has advanced by 101.1%. The company has suffered net losses since it started, including net losses of $3,305M for the six months ended June 30, 2022. The company also says that it may need to seek more equity or debt financing.
Rivian Automotive Inc. Performance Analysis
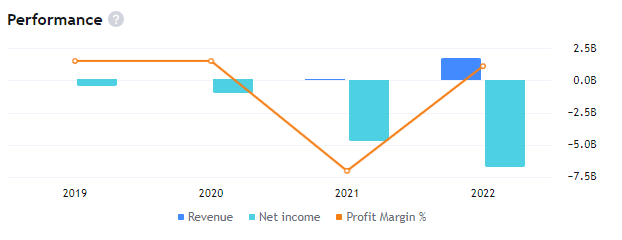
Rivian Automotive Inc. generated $12.56 Billion in revenue in the year 2022, leading to an increase of $1.83 Billion from the previous year. The company’s net income has dropped slightly to $4.62 Billion, with a profit margin of 36.77%. The company also has a debt of $5.54 Billion and the free cash flow has advanced compared to 2021.
RIVN Share Technical Analysis
a by writer11_gsm on TradingView.com
The RIVN share price is on an upward trend after a positive market structure that broke above the previous swing and is now supported by the same. The price may further rise to higher levels.
The stock price has risen above both the 50-day and the 200-day Exponential Moving Average, which are in a death cross pattern after the previous trend. This shows that the stock has a strong bullish momentum.
The RIVN share’s RSI has risen from the lower levels after reaching the overbought zone, which shows bullishness in the momentum. The RSI has also moved above the 50-level, which is a further sign of the trend’s strength.
Technical Overview of RIVN Stock
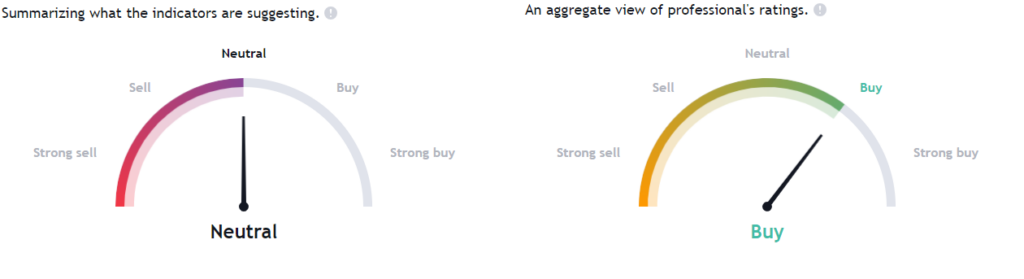
Source: Tradingview
The technical indicators for the stock represent uncertainty in the momentum of the share as 10 indicators including the oscillators are giving a sell signal and 8 are neutral with 8 indicators following a buy signal and the analysts are bullish on the stock following the fundamentals of the company.
Conclusion
The Rivian Automotive share is trading in an uptrend following a bullish market structure and the technical indicators like EMA and RSI are also acting bullish, the fundamentals of the share might look negative but as the company is new and has recently launched its product it might take some time in settling down.
Therefore, the price of the stock can advance to higher levels in the future if it sustains above the level of $19.50.
Technical Levels
- Support levels for the RIVN share are – $12.00 and $19.50
- Resistance levels for the RIVN share are – $ 28.00 and $35.00
Disclaimer
The information provided in this article, including the views and opinions expressed by the author or any individuals mentioned, is intended for informational purposes only. It is important to note that the article does not provide financial or investment advice. Investing or trading in cryptocurrency assets carries inherent risks and can result in financial loss.


