

- ALGO has been recording a negative development in the price of the token.
- It is currently trading at $0.096 with an intraday surge of 1.6%.
- The token is down by 97.06% from its all-time high.
The token has been in a strong downtrend for a long period of time. The price recorded a loss of almost 56% in the last 6 months and 69% in the last year. The price recently broke down below its support of $0.10 and is currently trading below it. Now, $0.87 is acting as a support for the price.
Additionally, the price broke down below the falling channel and went down further.


It is currently trading with an increase in the trading volume by 0.6% in the last 24 hours.
The token marked its all-time high on 21 June 2019 when it was priced at $3.28. It has a current circulating supply of 7.82 Billion ALGO which is 78.29% of its total supply. The token has a market cap of $755.01 Million and it has a 24-hour volume of $14.71 Million.
Sentiment Analysis
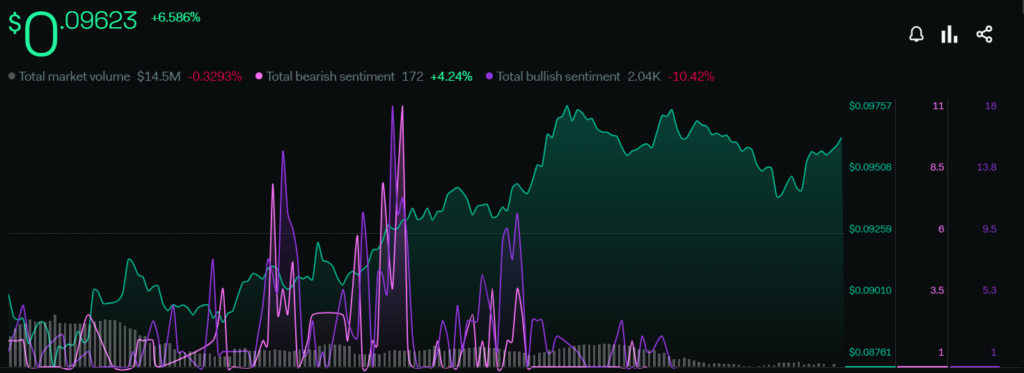
The price of the token has increased by 6.58% in the last week. The total market volume of the token has declined by 0.32% and the total bearish sentiments surged by 4.24%. The total bullish sentiments decreased by 10.42% which shows that the price is under the control of the bears. The overall sentiments are indicating a negative price action.
Technical Analysis (Daily – 1D)
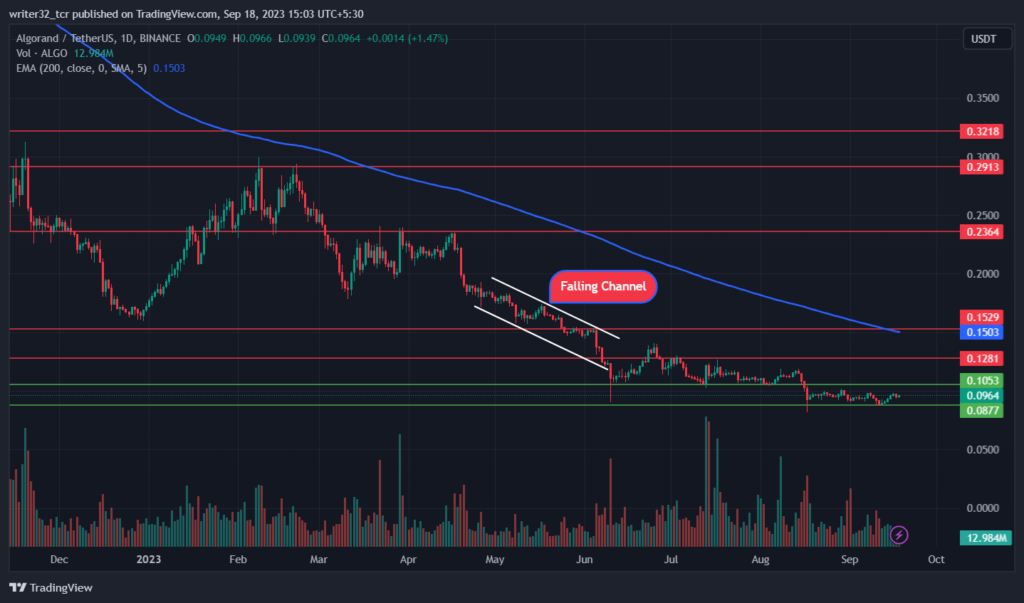
The price of the token has been recording a strong downfall for a long time. The price of the token has almost declined by half of its value in the last six months. The bearish investors are dominant and they are keeping the price in a downtrend.
The price also got through a falling channel from where the price broke below the falling channel and fell further.
The price is currently trading below the support level of $0.10 which will now act as a resistance level, the price is currently taking support from $0.87.
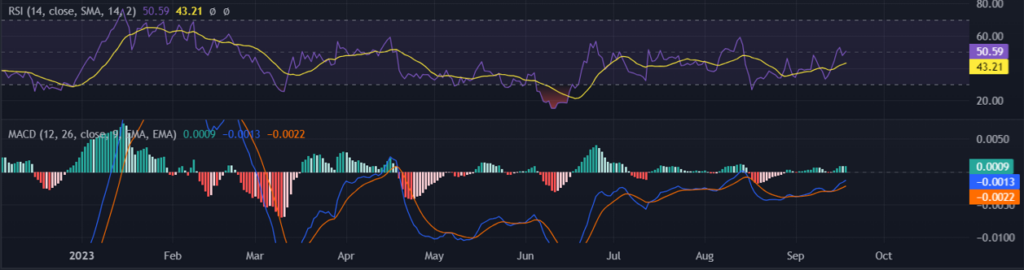
What the Indicators are Saying
The RSI is at 50.59 points and the 14-day SMA is at 43.21 points. The price is currently a bit above the neutral level of 50. The RSI is making higher highs which can be a positive sign for the short term uptrend in the price.
Coming to the MACD, the fast blue line moving average is moving above the red slow line moving average and the histogram is showing an increase in the volumes which is a positive sign for the price. However, the volume has to keep increasing for an uptrend in the price.
ALGO Live Chart
Conclusion
The price is currently in a downtrend. If the price has to move in an uptrend, then the price has to break the major short term resistance level of $0.15 with an immense trading volume. On the other hand, If the price breaks below the $0.087 support level, then the current downtrend will continue.
Technical Levels
Support: $0.087 and $0.10
Resistance: $0.12, $0.15, $0.23, $0.29 and $0.32
Disclaimer
The views and opinions stated by the author, or any people named in this article, are for informational purposes only and do not establish financial, investment, or other advice. Investing in or trading crypto assets comes with a risk of financial loss.


