

- LDO is currently trading at $1.53 with an intraday rise of 2.2%.
- It is down from its all-time high by 86.06%.
LDO is currently trading below the support level of $1.63, which is now acting as a resistance level for the price. The price has been in a downtrend for a notably long time. Since the last downfall of the price that started from 15th July 2023, the price started to make lower lows and it also broke the support levels of $1.82 and $1.63.
Lido DAO is a decentralized autonomous organization (DAO), it is a liquid staking protocol which operates on the ethereum blockchain. It is also used for governance and decision-making within the DAO.


It is currently trading with a fall of 12% in the trading volume.
The token marked its all-time high on 16th Nov 2021 when the token was priced at $11.
The current circulating supply of the token is 889.94M LDO which is 88.99% of its total supply. It has a market cap of $1.36B and the 24-hour trading volume of the token is $33.62 Million.
Lido Analytics: Aug 28 – Sep 4, 2023
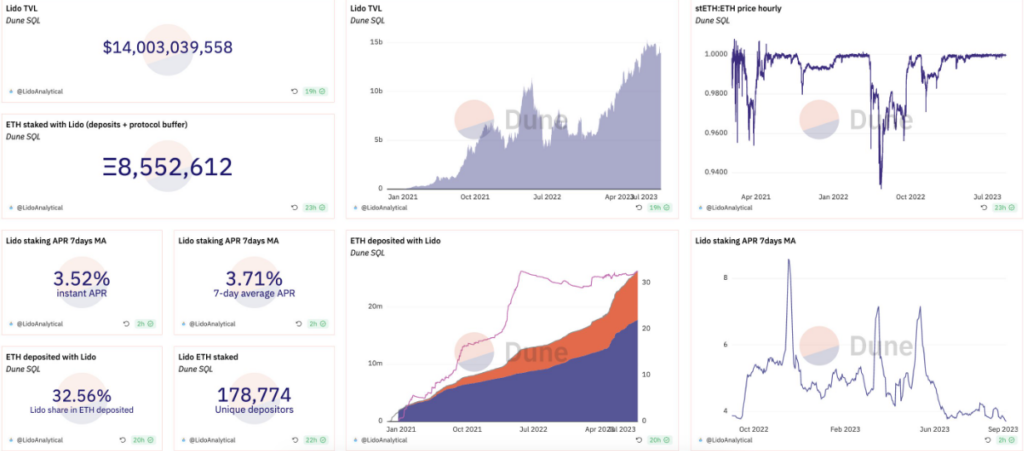
– TVL up 0.4% to $14.1b due to growth in deposits.
– stETH APR down slightly with a 7d MA at 3.75%.
– 7d net new deposits of 139,648 ETH.
– DeFi pools hold 37% of stETH supply with 3.16m (w)stETH.
– Aave V3 wstETH pool up by 17.44%.
Sentiment Analysis:
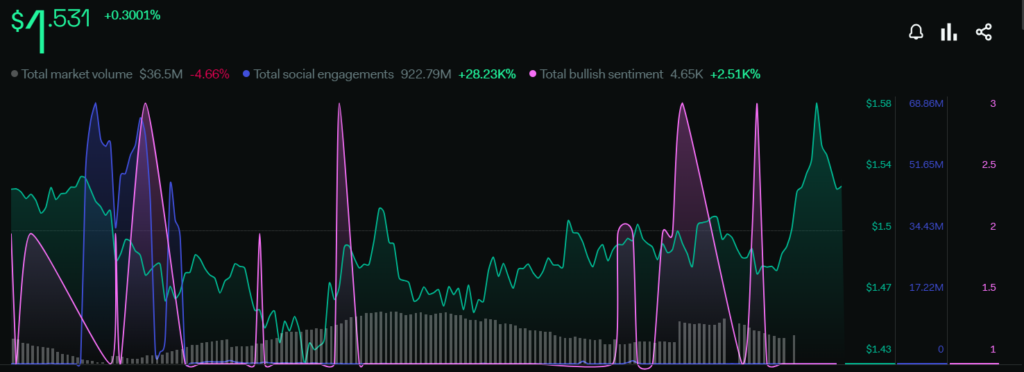
The price of the token has increased by 0.30% in the last week, the total market volume has decreased by 4.66%. The total social engagements have increased by 28.23K%. The total bullish sentiments surged by 2.51K% which shows that the community is also very strong and they are also bullish on the price action.
Technical Analysis (1-Day Timeframe)
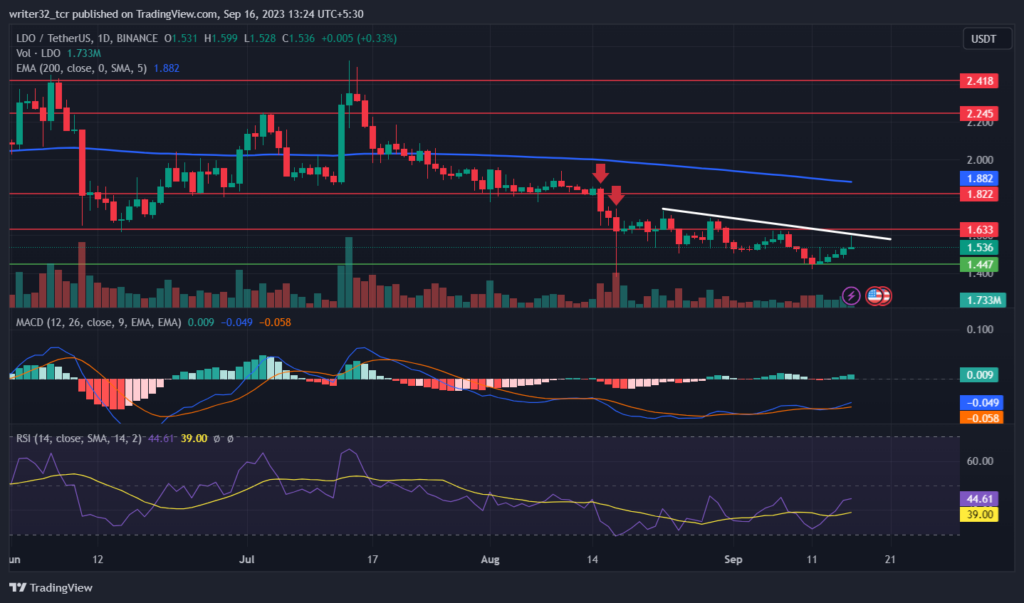
The price took support from $1.44 and is currently trading at $1.53 where it is facing rejection from the bearish trendline and also from the last lower low.
If the price breaks the last lower low and also the bearish trendline, then we can see a further upward move up to $1.82. The next target after breaking the $1.82 resistance will be $2.24.
On the other hand, If the price gets rejected from the bearish trendline then it will fall to $1.44 and may also break below it and fall even lower. The next support will be at $1.25.
What the Indicators Say
The RSI is moving upwards and it is currently at 44.61 points. The price is currently below the neutral level 50. The 14-Day SMA is at 39.00 points. The RSI is currently indicating a bearish movement in the price.
Coming to the MACD, the fast blue line MA is moving above the slow red line MA, which indicates an upward price movement and the histogram is showing a slight increase in the volume.
To reach the $3 range, some major resistance levels have to be broken where the bullish investors have to be very active and keep on beating the bearish investors. The major resistance will be the $2.4 level.
LDO LIVE CHART :
Conclusion
We should wait for the price to break the last lower low and the bearish trendline for the entries to confirm the uptrend. If the price gets rejected we will continue the downtrend in the price.
Technical Levels :
Support: $1.44 and $1.25
Resistance: $1.63, $1.82, $2.24 and $2.4.
Disclaimer
The views and opinions stated by the author, or any people named in this article, are for informational purposes only and do not establish financial, investment, or other advice. Investing in or trading crypto assets comes with a risk of financial loss.


