

- LRC is trading under the demand zone.
- It is currently trading at $0.176 with a decline in the price by 1.5% in the last 24 hours.
- The token is down by 95.39% from its all-time high.
The token has been in a downfall since the april of this year. The high of the year 2023 was marked at $0.495. The token after getting down from ATH broke below the 200 day-EMA and fell to the level of $0.25 and then price took support from there.
And then the price started an upward movement and once again crossed above the 200-day EMA and then got rejected from the $0.475 range. The price after falling from the $0.475 has been significantly falling and broke the support levels of $0.30 and $0.24 which are now acting as resistance for the price.


The price is currently trading at the support level of $0.17 from where the price is likely to take support and bounce and start a bullish rally as this is the demand zone for the price.
The token is currently trading with a repulse in trading volume by 9.75%. The market cap of the token has decreased by 1.12% in the last 24 hours.
- The present market cap of the token is $235.11M.
- It has a current circulating supply of 1.33B LRC which is 96.88% of its total supply.
- The 24-hour volume of the token is $6.67M.
SENTIMENT ANALYSIS :
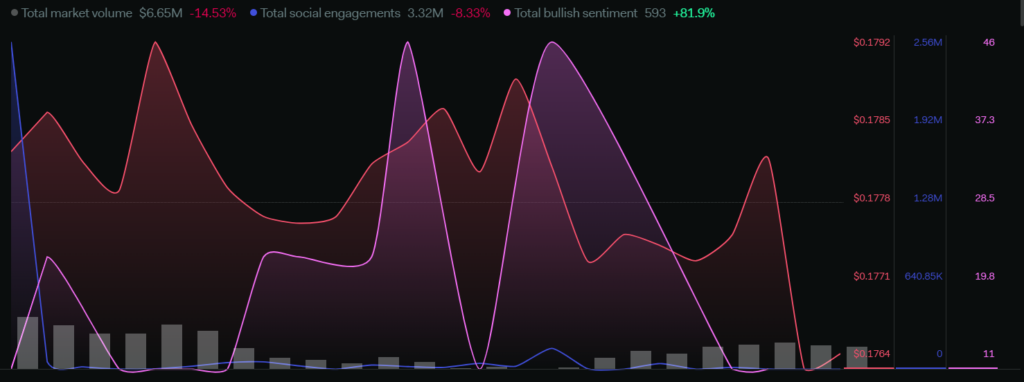
The total volume of the token has declined by 14.53%. The total social engagements have decreased by 8.33% in the last 24 hours, the total bullish sentiments of the token surged by 81.9%.
The overall sentiments are showing a bearish price of the market of the token. But, as the price is under the demand zone the bullish investors will start buying at this zone and the price will bounce upwards and start a bullish trend.

The total bearish sentiments have also increased by 427.3%. If the price falls from the $0.17 and the volume does not increase then the next support will be at $0.15 and $0.12.
TECHNICAL ANALYSIS ( DAILY – 1D ) :
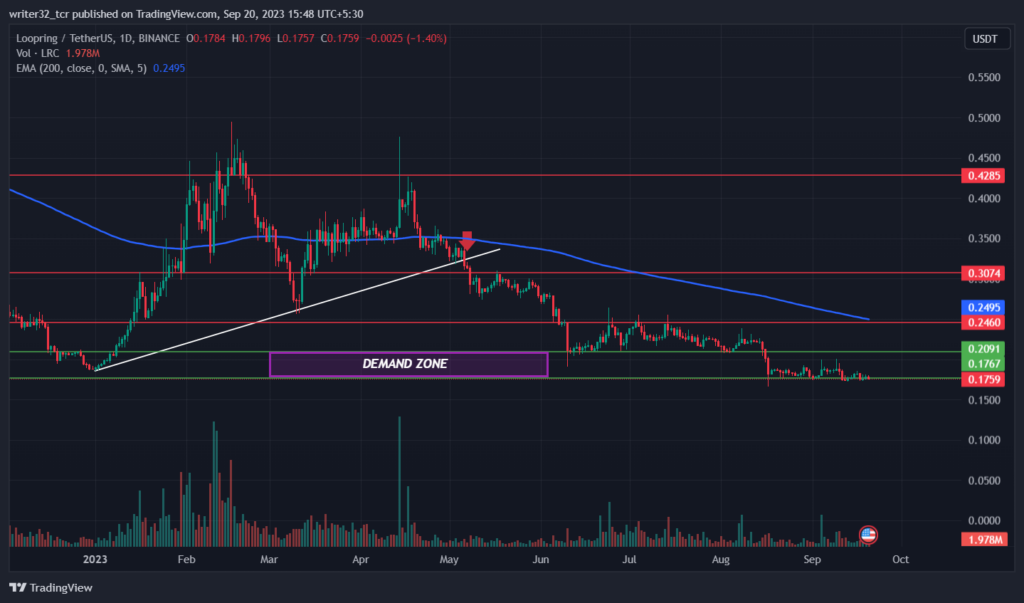
The price started to move on a trendline and after some time the price broke down below the trendline on 6th May 2023 from where the price fell further and reached the level of $0.20 support.
Currently, The price is trading at the support level of $0.176 from where the chances are high that the price will take support as it is a demand zone also. In the opposite scenario the price can fall further to the levels of $0.15 and $0.12.
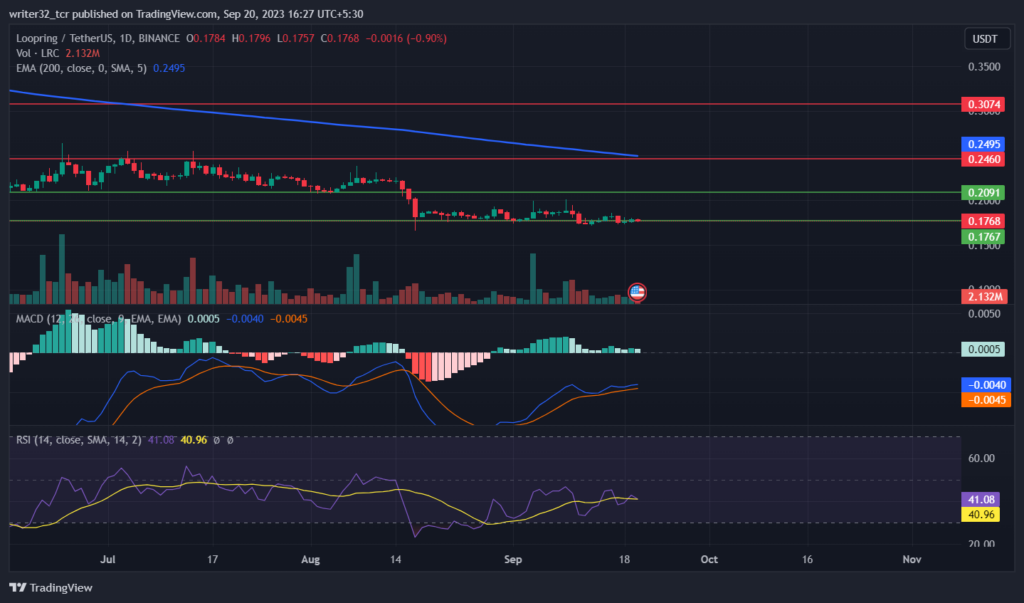
Relative Strength Index ( RSI )
The line of RSI is currently moving at 41.08 points and the SMA 14 line is moving at 41.08 points. The RSI is below the neutral level 50 which indicates there has been a lot of selling pressure in the market, If the price falls under RSI 30 then the price will enter the oversold region and the price will be bearish. If the price moves above RSI 50 then it will indicate towards the buying in the market of the token from where the price will start rising.
Moving Average Convergence/Divergence ( MACD )
In MACD, The fast blue line moving average is above the red slow line moving average and the histogram is showing a decrease in the volume which shows bearishness of the price. The volume has to increase if the price has to move upwards.
LRC LIVE CHART :
CONCLUSION :
The price is currently under the demand zone from where the price is likely to bounce and start to move upwards towards a bullish trend. Also, If the price falls below the support level of $0.176 then we will continue the downtrend in the price of the token.
TECHNICAL LEVELS :
SUPPORT : $0.176 AND $0.20
RESISTANCE : $0.24 AND $0.30
Disclaimer
The views and opinions stated by the author, or any people named in this article, are for informational purposes only and do not establish financial, investment, or other advice. Investing in or trading crypto assets comes with a risk of financial loss.


