

- The price of the token is currently moving below the 20 and 50 day EMA.
- It is currently trading at $0.448 with an intraday surge of 2.11%.
- The token is down by 73.89% from it’s all-time high.
SUI network has reached a user base of 6 million in just 4 months after the launch of its mainnet. The network’s logicality and speed are operated by its moving programming language. Sui is a first-of-its-kind Layer 1 blockchain and smart contract platform designed from the bottom up to make digital asset ownership fast, private, secure, and accessible to everyone.
The token is currently trading with a rise in the trading volume by 14.3% in the last 24 hours. The all-time high of the token was marked on 3rd MAY 2023 where the token was priced at $1.72.


- The token has a current market capitalization of $354.72M.
- It has a circulating supply of 791.77M SUI which is only 7.92% of its total supply.
- The 24-hour trading volume is $61.66M.
The performance of the token has not been well as the token has decreased its value in the last 3 months by 45.32% and 20% in the last 1 month.
TECHNICAL ANALYSIS ( DAILY – 1D )
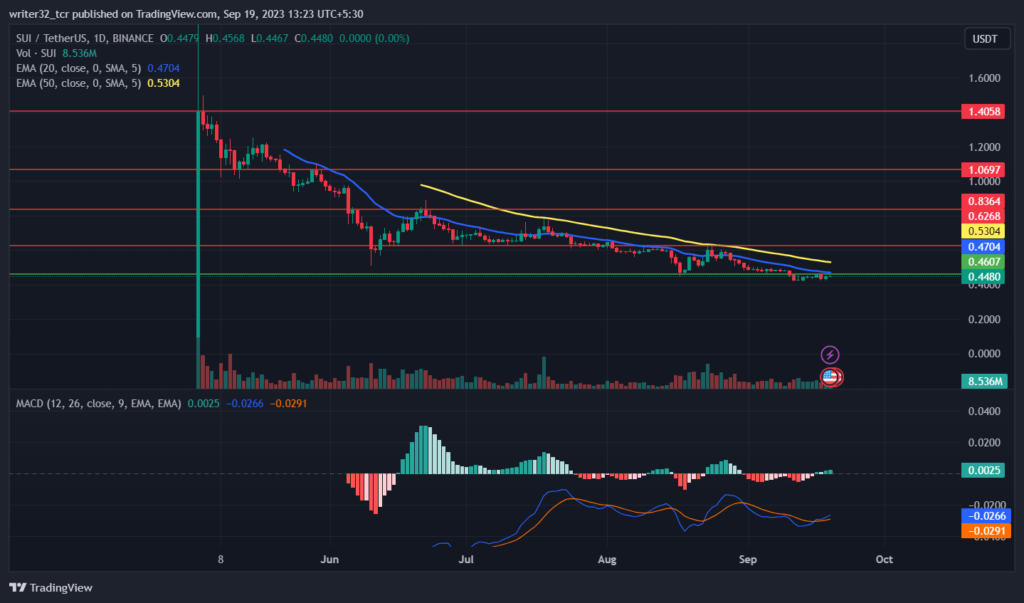
The token is currently in a downtrend after making its all-time high. It has been forming lower lows continuously and it is currently trading below the support level of $0.46 from where the price will likely take the support and move towards its next target of $0.62 resistance.
If the price successfully takes the support then it will move above the 20 day EMA and if the price reaches and breaks the 50 day EMA then the price will be in a bull action.
SUI LIVE CHART :
Moving Average Convergence/Divergence ( MACD )
In MACD, The fast blue line moving average has just crossed above the red slow line moving average and the histogram is showing a little increase in the volumes which is a positive sign for the price. But the volume has to significantly keep increasing if we want an uptrend in the price.
Relative Strength Index ( RSI )
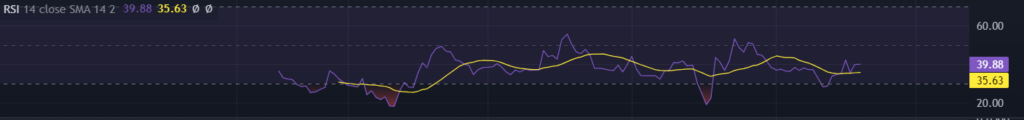
The RSI is currently moving at 39.88 points and the SMA 14 is moving at 35.63 points, the RSI is below the neutral level 50 and very close to the oversold region. The RSI above 50 will give us some positivity in the price of the token. If the price reaches below the 30 points then we will be in the oversold region and we can see some downfall in the prices if we get there.
CONCLUSION :
The price of the SUI is currently under a bearish trend. The support from the $0.46 can give us some upward movement if the price successfully tests from the support level. Also, the RSI is currently showing a bearish movement in the price.
TECHNICAL LEVELS :
SUPPORT : $0.46
RESISTANCE : $0.626, $0.836, $1.06, $1.40
Disclaimer
The views and opinions stated by the author, or any people named in this article, are for informational purposes only and do not establish financial, investment, or other advice. Investing in or trading crypto assets comes with a risk of financial loss.


