
- SAND has formed a falling wedge pattern.
- It is currently trading at $0.303 with an intraday rise of 2.98%.
- The token is down by 96.4% from its all-time high.
The Sandbox token has formed a falling wedge pattern in the daily time frame. The token has been in a downtrend for a long time. The price is currently trying to break above the top of the falling wedge to start an uptrend. If the price breaks above this and above the resistance level of $0.31 which was the previous support level, then it will confirm the uptrend.
It is currently trading with a decline of 4.95% in its trading volume in the last 24 hours.


The token marked its all-time high on 25th November 2021 when it was priced at $8.44.
It has a current circulating supply of 2.064 Billion SAND which is 63.83% of its total supply. The token has a market cap of $626.82 Million and the 24-hour trading volume of the token is $30.37 Million.
Sentiment Analysis
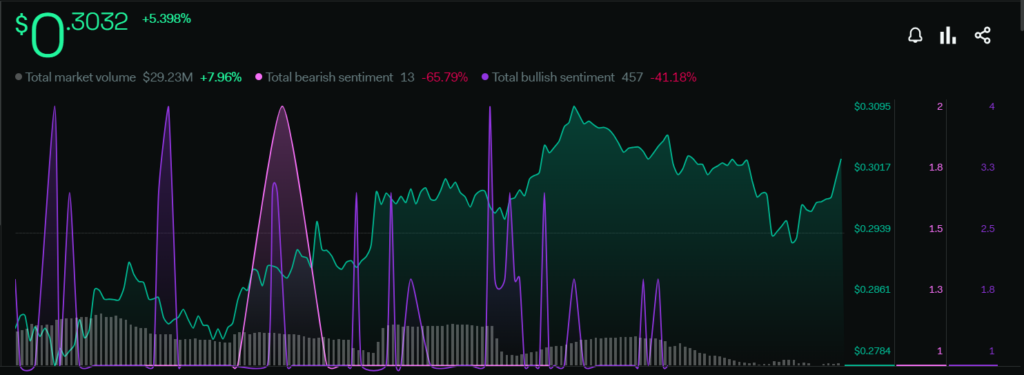
The price of the token has increased by 5.396% in the last week. The total market volume of the token has also surged by 7.96%. The total bearish sentiments of the token declined by 65.79%, the total bullish sentiments also decreased by 41.19%. The overall sentiments are indicating equal bullish and bearish momentum.
The bullish move is more likely to happen as the bullish sentiments are decreasing less than the bearish sentiments.
Technical Analysis
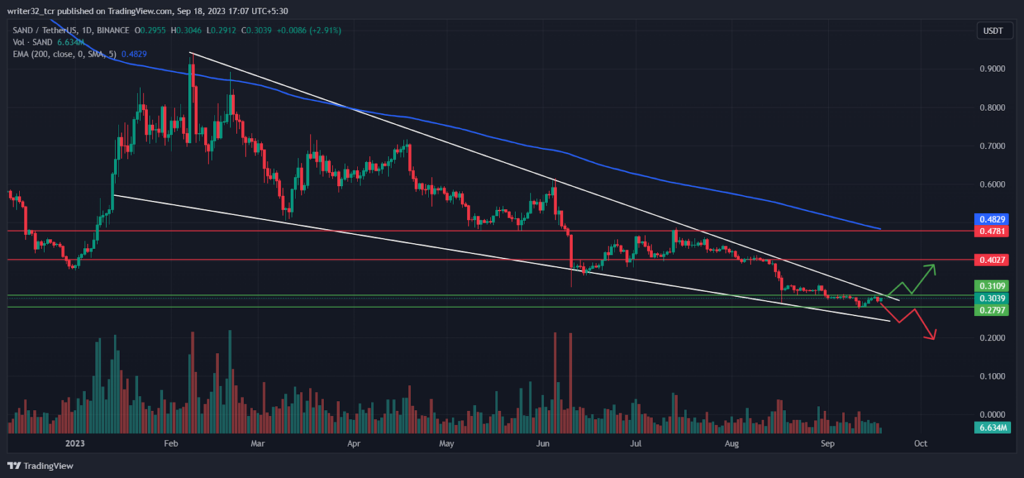
As we can see in the chart, the price is currently trying to break above the falling wedge and if it manages to do so and if it also breaks above the $0.31 resistance level, then it can easily reach $0.40.
On the other hand, If the price gets rejected from the top of the falling wedge and falls again, then it will break the support of $0.279 and the next support will be created at the bottom of the falling wedge. If the price breaks below the bottom of the falling wedge
then the next support will be at $0.26.
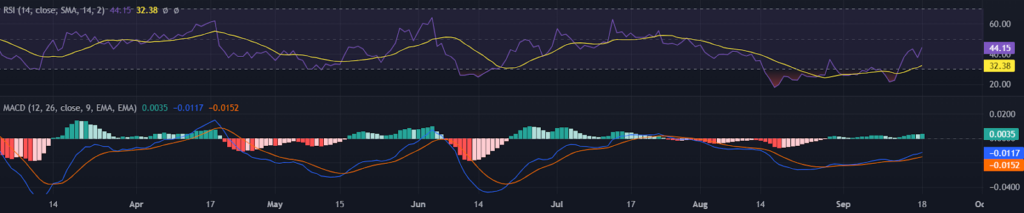
What the Indicators Are Showing
The RSI is currently at 44.15 points and the 14-day SMA is at 32.38 points, the RSI is below the neutral level of 50 and is currently trying to move above it. The RSI above 50 would indicate some positivity in the price of the token.
Coming to the MACD, the fast blue line moving average is moving above the red slow line moving average and the histogram is showing an increase in the volumes which is a positive sign for the price. However, the volume has to keep increasing significantly if there is to be an uptrend in the price.
SAND LIVE CHART :
Conclusion
If the price breaks above from the top of the falling wedge, then the price can be bullish for a short term. If the price gets rejected from the top, then the downtrend will continue. The bullish investors in the market have to be active for a bullish move in the price of the token.
Technical Levels
Support: $0.279 and $0.31
Resistance: $0.40 and $0.478
Disclaimer
The views and opinions stated by the author, or any people named in this article, are for informational purposes only and do not establish financial, investment, or other advice. Investing in or trading crypto assets comes with a risk of financial loss.


