

- The Admiral Group stock is in an uptrend as the price has jumped by 2.05% in a week, 3.08% in a month, and 14.05% in a year.
- The net debt of the company has been rising year on year since 2016.
- This firm’s Basic earnings per share (EPS) has fallen by 37.72% in 2022.
Market Capital of the ADM stock – 7.421 Billion GBP
Current Market Price of ADM Stock – 2444 GBX


The ADM Stock Overview
ADM stock’s price jumped by 29 GBX in its previous trading session on 21 September, witnessing a rise of 1.2% intraday. The price is in an overall uptrend on almost every horizon. It has surged by over 2.05% in a week, 3.08% in a month, and 14.05% in a year. It shows that the buyers are in full control over the price.
The Admiral Group’s revenue took a hit by 2.20% in the last result as the revenue declined by 0.04 Billion GBP. Although the revenue has been rising steadily over the years, it jumped from 1.01 Billion GBP in 2016 to 1.52 Billion GBP in 2022. The net income of the company has declined massively by 37.15% in the last financial report. It has risen significantly since 2016.
The net debt of the company has increased multifold in 6 years as the company posted a net positive cash flow in 2016 and 2017. It has risen from 67.05 Million GBP to 730.60 Million GBP in the last 4 years, which is a matter of concern for the management.
Technical Analysis of the ADM Stock
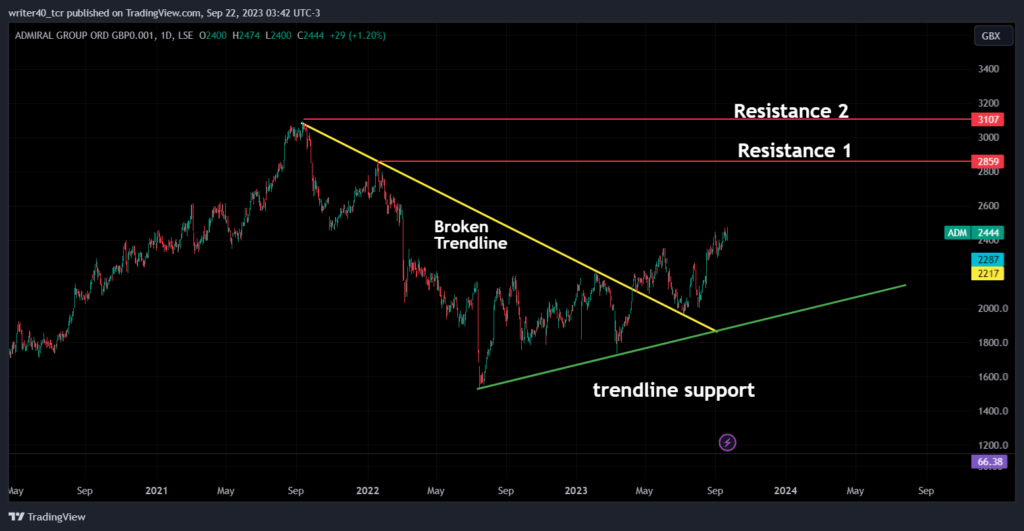
ADM stock’s price is trading at the 52-week level of 2474 GBX, which it created today itself. The price has been trading flat for 5 days in a range of 2391 GBX and 2474 GBX. It broke the symmetrical triangle pattern in April 2023. The price tested the levels and is now trading comfortably above the breakout levels.
The stock price has been supported by the rising trendline of the pattern, which is present near the level of 1910 GBX. It is looking bullish and it seems the price will soon challenge the resistance level of 2856 GBX which is drawn on the chart as resistance 1. The next possible resistance the price can face is near the 3100 GBX level. It has been drawn as resistance 2 on the chart.
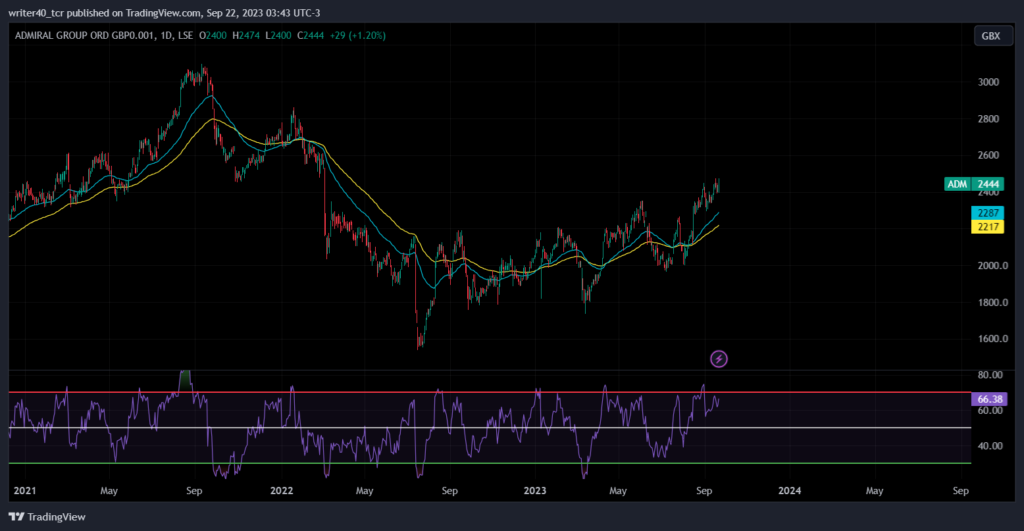
The stock price is currently trading above both the 50 and 100 Exponential Moving Averages which are present at 2222 GBX and 2294 GBX. The EMAs will provide some necessary support to the price which can push the price up. The Relative Strength Index (RSI) is placed comfortably above 50 which is a sign of bullish momentum.
Conclusion
ADM stock’s price is currently trading at a 52-week low level. It shows that the price is heavily bullish as of now. The RSI is present at 66.38, which supports the above statement. The financials took a hit but are expected to perform well in the near future which will boost the price up. The major resistance the stock can face is near the 2859 GBX. The support for the price is present near the level of 2000 GBX.
Technical Levels
Resistance – 2859 GBX and 3100 GBX
Support – 2000 GBX and 1970 GBX
Disclaimer
The views and opinions stated by the author, or any people named in this article, are for informational purposes only. They do not establish financial, investment, or other advice. Investing in or trading crypto assets comes with a risk of financial loss.


