

- CFX coin’s price has surged remarkably by 191.74% in a year.
- CFX’s price has been consolidating in a range since 18 August.
- The coin’s price has melted down over 93% from its all-time high.
Market capital of CFX Coin – $414.42 Million
The current market price of CFX Coin – $0.1270


CFX’s Coin Overview:
The CFX’s coin price in the current session is trading with a minor decline of $0.0006 with a fall of 0.55%. The price has surged by 5.65% in a week but declined by 3.05% in a month. This contradictory move states that both the buyers and sellers are still trying to overpower each other.
The CFX’s price has surged significantly by over 191.74% which signifies that the price has been dominated by the bulls over the year. The price of the stock is trading in a flat range and the price is trading inside the range of 17 August’s candle. Till now, the price has not been able to close outside this candle.
The price has melted down over 93.26% from its high of $1.85 created in May 2021. If we co-relate the price performance of Bitcoin and CFX, then we can observe that the CFX has outperformed this year. Bitcoin has only surged 36.92% in one year whereas the CFX has surged over 191.74%.
Technical Analysis Of CFX’s Coin
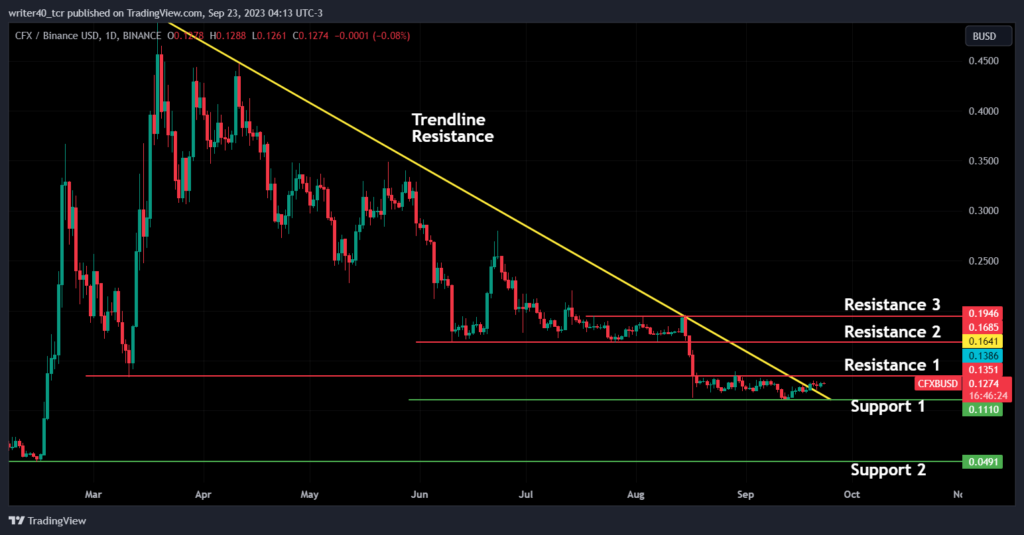
The price might have formed a base near the level of $0.1110 and the price is currently consolidating between $0.1351 and $0.1110. The coin has also created a trendline resistance and recently broken the trendline. Price even after breaking the resistance trendline is trading flat and no major movement is visible in the price.
The resistance for the price is present at the level near $0.1351. The second resistance for the price from where the price can face some rejection is near $0.1685. If we talk about the support level then the price is taking support from the level of $0.1110. CFX’s price can take the support from $0.0491 if it breaks the $0.1110 level.
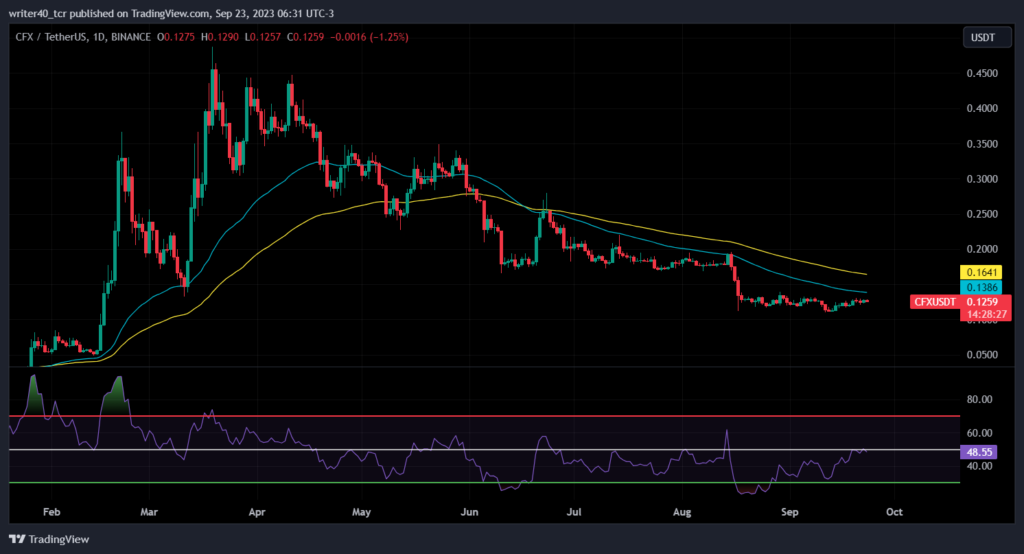
The CFX’s coin price is trading below the 50-day and 100-day moving average, which signifies that the current trend of the coin is bearish. Both the EMAs are currently present at $0.1386 and $0.1641 and can act as a resistance to the price. The Relative Strength Index is placed just below 50 and is rising from the oversold trajectory.
Conclusion
The price of the CFX’s coin is consolidating inside the range of one candle i.e. of 17 August. The price is waiting to cross and close on either side of that candle. If the price breaks and closes above that candle then it can try to move towards the level of $0.1946. If the price breaks the level on the downside, then it can try to achieve the level of $0.0491.
Technical Levels
Resistance – $0.1351 and $0.1685
Support – $0.1110 and $0.0491
Disclaimer
The views and opinions stated by the author, or any people named in this article, are for informational purposes only. They do not establish financial, investment, or other advice. Investing in or trading crypto assets comes with a risk of financial loss.


