

- The Pfizer stock price is in a downtrend as it has declined by 25.14% in a year.
- Revenue and Net income jumped by 23.43% and 41.62% respectively.
- The stock price is trading below its 50-day and 100-day Exponential Moving Averages.
Market Capital of Pfizer – $184.56 Billion
The current market price of Pfizer – $32.69


Pfizer’s Stock Overview
The Pfizer stock in its previous trading session has declined by $0.16 with a fall of 0.49%. The stock is currently in a downtrend as the price has fallen by 4.02% in a week, 11.86% in a month, and 25.14% in a year. It shows that the price of the stock has faced a strong rejection at every rise and sellers are more aggressive in this counter.
Pfizer stock’s revenue has surged for the third time in a row which indicates that the company is performing well in its revenue aspect. The revenue has jumped from $52.82 Billion in 2016 to $100.33 Billion in 2022. The net profit of the company has surged by 141.81% and 41.62% in the last 2 years.
The net debt of the company has surged in the last report by 60% after declining for 3 years.
The net debt in 2019 was $43.80 Billion, which is now standing at $16.31 Billion in 2022. A decline of over 62% in three years, which is a good sign for the company. The dividend yield of the company is 3.14% which is adequate.
Technical Analysis of Pfizer’s Stock
The price of the stock is in a strong downtrend as the price of the stock has declined by over 43% from its all-time high level of $57.95. It is forming a lower high and lower low pattern, which is a sign of a bearish trend. The price has declined for three consecutive trading sessions with a strong bearish candle.
The Stock has formed a falling wedge pattern on the daily chart, but it has broken the pattern on the lower side. It is a signal that the buyers are very low in confidence. The sellers have taken control of the price at every level.
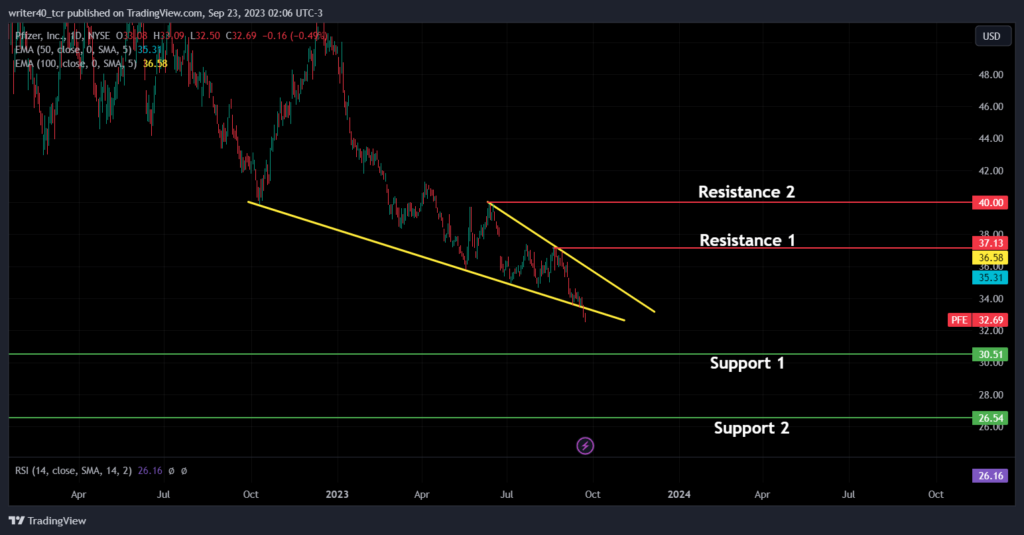
The price after breaking a trendline of the falling wedge on the lower side is heading towards the level of $30.51 which is drawn as support 1 on the chart. The second support level which is present on the chart is near the level of $26.54. If the price reverses from any of the levels, it can face rejection near the level of $37.13 and $40.00. That is drawn on the above chart as resistance 1 and resistance 2 respectively.
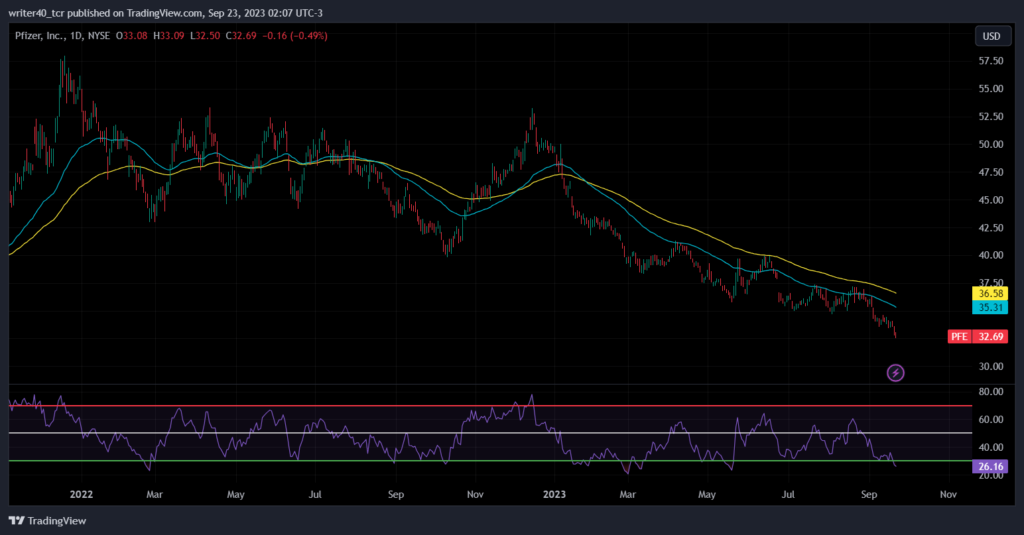
The price of Pfizer stock is currently trading below both the important Exponential Moving Averages of 50 and 100. The EMAs are present near $35.31 and $36.58 levels. The slope of the EMAs is down and well above the price, showing that the stock is witnessing a sharp decline in its price. The RSI is placed in an oversold trajectory, which means the downside is limited now.
Conclusion
The price of the Pfizer stock has broken the falling wedge pattern on the lower side, so it unlocked the lower level of $30.51. The RSI is in an oversold trajectory. It indicates that the downside is very limited and stock can pause the downfall soon. Financials are performing well which can surely provide some boost to the price.
Technical Levels
Resistance – $37.13 and $40.00
Support – $30.51 and $26.54
Disclaimer
The views and opinions stated by the author, or any people named in this article, are for informational purposes only. They do not establish financial, investment, or other advice. Investing in or trading crypto assets comes with a risk of financial loss.


